.png)
Introduction
In today’s fast-paced business world, Chief Financial Officers (CFOs) juggle managing daily financial operations while steering their organizations toward long-term goals. As businesses grow, maintaining clear visibility into expenses, uncovering savings opportunities, and accurately predicting financial outcomes becomes increasingly challenging.
CFO dashboard provide valuable support for CFOs by delivering real-time insights and intuitive analytics. These dashboards simplify expense tracking, highlight cost-saving opportunities, and facilitate confident, strategic decision-making.
In this blog, we'll explore the key benefits of CFO dashboards and demonstrate how Cloudchipr’s customizable solutions can help CFOs efficiently manage cloud spending and enhance overall financial performance.
What is a CFO Dashboard ?
A CFO dashboard addresses these challenges by consolidating critical financial data into a single, user-friendly interface. With real-time data visualization, interactive analytics, and predictive insights, these dashboards deliver immediate clarity on key financial metrics such as revenue trends, expense analysis, cash flow forecasts, and budget performance. By providing easy access to actionable insights, CFO dashboards empower financial leaders to swiftly identify risks, pinpoint cost-saving opportunities, and confidently guide strategic initiatives.
How CFO Dashboards Improve Financial Efficiency
CFO Dashboards transform raw financial and billing data into clear, actionable insights, helping organizations optimize spending and enhance efficiency. Here are the key advantages of using CFO dashboards:
Real-time Cost Visibility
Dashboards offer immediate insights into spending patterns, anomalies, and financial risks. For example, unexpected spikes in cloud expenses can be quickly identified, enabling IT and finance teams to promptly investigate and address unnecessary costs before they escalate.
Data Consolidation
By integrating cost and usage data from multiple cloud providers, accounts, and services, dashboards eliminate data silos and create a unified financial perspective. This ensures accuracy, simplifies financial management, and aligns cloud spending closely with organizational goals.
Cost Optimization
Dashboards highlight inefficiencies by categorizing expenses by service, region, account, and other cost-related factors. Organizations can leverage these insights to identify underused resources, optimize reserved instance strategies, and shift workloads to more cost-effective solutions, aligning spending with strategic objectives.
Improved Forecasting
Dashboards enable teams to review historical spending trends to inform budgeting and financial planning. By analyzing past patterns, teams can accurately predict future expenses, set realistic budgets, and allocate resources more effectively to avoid overspending.
Enhanced Visibility
Dashboards present key performance indicators (KPIs) in an intuitive and easy-to-understand format. This clear visibility empowers CFOs to quickly identify critical areas, prioritize actions, and maintain alignment with overall financial goals.
CFO Dashboards in Cloudchipr
Cloudchipr’s dashboards provide finance teams with clear visibility and precise control over cloud expenditures, enabling CFOs to make smarter financial decisions and effectively manage costs. By bringing together critical financial data into an intuitive and centralized interface, Cloudchipr simplifies the process of tracking cloud spending, quickly identifying irregularities, and achieving greater overall financial efficiency.
One of Cloudchipr’s greatest strengths is its remarkable flexibility. Organizations can create an unlimited number of customized dashboards, each tailored to address specific needs. With a wide variety of widgets designed to monitor key financial metrics, CFOs can effortlessly track performance across different teams, projects, or business units. Additionally, Cloudchipr offers advanced management features, allowing dashboards to be set as public or private, providing precise control over who can access financial insights.
Here’s an overview of the essential widgets available to CFOs within Cloudchipr:
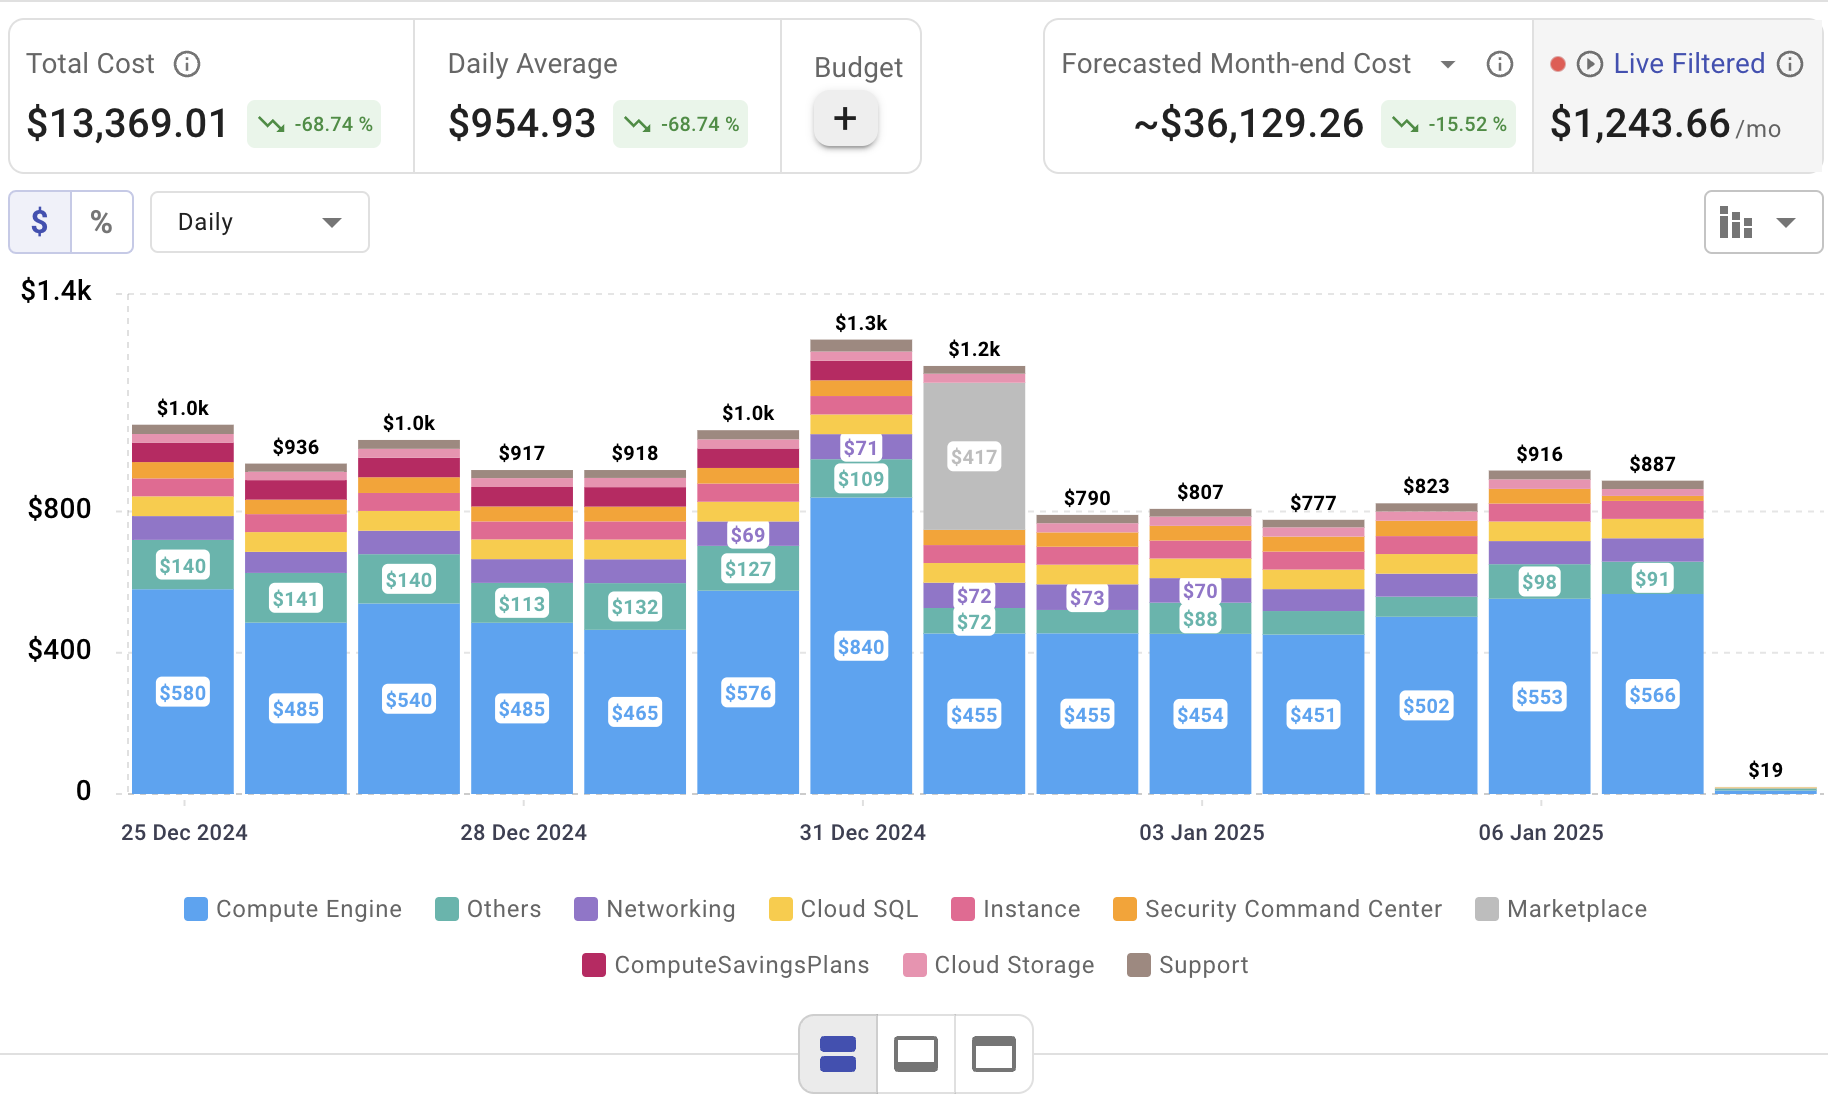
Billing Summary
This widget provides a high-level overview of cloud expenses, providing a clear view of total spending over selected time periods.

Here you can see the core metrics that exist for the Billing Summary widget. The data comes directly from the Billing Report, which is generated in the Billing Explorer tab. The widget can be customized by selecting a different Billing Report, specifying a time period, and choosing a preferred visualization. Additionally, individual metrics can be enabled or disabled, as shown in the following picture:

Billing Explorer
The Billing Explorer widget provides a detailed breakdown of cloud spending, helping users analyze costs across various dimensions. With flexible grouping, visualization, and filtering options, it enables organizations to gain deeper insights into their cloud expenses.

The widget allows users to customize their cost analysis by selecting specific billing reports, grouping data by key attributes such as service, account, region, or cloud provider, and choosing from multiple visualization types, including Bar Chart, Stacked Chart, and Pie Chart. Additionally, users can fine-tune their analysis by adjusting chart granularity and enabling aggregations, ensuring the widget aligns with their financial monitoring needs. You can see the details in the picture:

Cost Anomalies
The Cost Anomalies widget helps quickly identify and understand significant changes in cloud expenditures over specified periods, enabling proactive financial management.

With this widget, users can easily compare current costs to previous timeframes and analyze expenses across multiple dimensions, such as service, account, region, product family, or cloud provider. Users can filter results based on cost increases or decreases, swiftly pinpointing unusual spending spikes or unexpected savings.
The widget also allows users to customize the analysis by setting specific time ranges, sorting anomalies by percentage or absolute differences, and defining minimum cost thresholds. This ensures the dashboard highlights only the most impactful anomalies, empowering finance teams to swiftly address potential issues.

Commitments Utilization
The Commitments Utilization widget provides essential insights into your financial commitments, specifically Reserved Instances (RIs) and Savings Plans (SPs). It highlights key financial metrics such as total commitments, net savings, and utilization percentage, allowing CFOs to assess the effectiveness and efficiency of their cost-saving strategies.

Highly customizable, this widget lets users tailor the displayed data to match their specific financial monitoring requirements. Users can select the type of commitments to analyze (RIs, SPs, or both), filter data by specific cloud accounts through the Organization selection, and define custom time periods. Additionally, the widget offers a variety of visualization options, enabling users to choose the chart type that best suits their analytical needs.

Commitments Coverage
The Commitments Coverage widget provides CFOs with detailed visibility into how effectively cloud workloads are covered by committed usage plans such as Reserved Instances and Savings Plans. This helps financial leaders strategically balance cost savings with operational flexibility.

Key metrics available within this widget include Covered Resources, Uncovered Resources, Real Costs, and Net Savings. Users can easily customize their analysis by grouping data, filtering by specific organizational units, defining custom time periods, and selecting preferred visualization types. Additionally, the widget offers advanced trend analysis options, such as Month-over-Month or Period-over-Period comparisons, allowing CFOs to track performance trends and optimize their commitment strategies effectively.

Conclusion
In today's complex financial landscape, CFO dashboards have become indispensable for organizations aiming to enhance financial clarity, efficiency, and strategic decision-making. By transforming raw financial data into clear, actionable insights, these dashboards empower CFOs to proactively manage expenses, identify savings opportunities, and accurately forecast financial outcomes.
Cloudchipr’s customizable CFO dashboards take this capability to the next level, offering finance teams exceptional flexibility, intuitive analytics, and detailed insights into cloud spending. With powerful widgets designed for real-time visibility, cost anomaly detection, commitment optimization, and more, Cloudchipr enables CFOs to confidently navigate financial complexities and drive their organizations toward greater financial success.