Datadog Alternatives: Choosing the Right Monitoring Solution
.png)
Introduction
Enterprises and DevOps teams widely use Datadog for full-stack observability (metrics, logs, traces, APM). However, it can become “impossibly expensive” and opaque as usage grows. Many organizations are now seeking alternatives to Datadog that offer similar insights with more predictable costs or open standards. In fact, analysts note an “ongoing trend of moving away from proprietary platforms in favor of … an observability platform that is transparent, cost-effective, and based on open standards.” This guide surveys a range of Datadog alternatives — from free/open-source tools to cloud-native services and other enterprise platforms — along with their key features, use cases, and cost models.
Why Consider Alternatives to Datadog?
Datadog is a powerful all-in-one monitoring suite, but teams often look elsewhere for several reasons. Customers report issues like unexpected bills, complex pricing, and vendor lock-in. For example, Grafana users said Datadog felt “impossibly expensive” with no transparency on costs. In many cases, the answer is to move to an open, usage-based, or self-hosted solution. Indeed, a recent analysis found that Grafana Cloud (a managed open-source stack) was “often significantly more affordable” than Datadog for large-scale use, making cost governance easier. Other motivations include avoiding vendor lock-in and preferring a platform that can be fine-tuned in-house.
Open-Source and Free Datadog Alternatives
Several high-quality open-source tools can replace or complement Datadog’s functionality. These projects are typically free to self-host (apart from your infrastructure costs) and have active communities. They often require more setup and maintenance, but incur no licensing fees. Key open/free alternatives include:
Prometheus (Metrics & Alerting)

A graduated CNCF project, Prometheus is a leading open-source monitoring system for metrics. It provides efficient time-series storage, a powerful query language (PromQL), and a built-in Alertmanager. Prometheus has built-in service discovery (ideal for Kubernetes and dynamic cloud environments) and an extensive ecosystem of exporters for servers, databases, and hardware. It scales well with containerized workloads, though it has a learning curve with PromQL and federation.
Grafana (Visualization & Dashboards)

Grafana is an open-source platform for metrics visualization and analytics. It supports dozens of data sources (Prometheus, InfluxDB, Elasticsearch, OpenTelemetry, and more) and lets you build custom dashboards and alerts. Grafana’s strength is its versatility: it can pull data from almost any source and present it in a unified UI. Teams often use Grafana with Prometheus, Loki, or other backends to achieve full observability. (Grafana Labs also offers Grafana Cloud, a managed service with a generous free tier.)
Loki + Tempo

Part of the Grafana ecosystem, Loki is a log aggregation system, and Tempo is for distributed tracing. Both are open-source and integrate seamlessly with Grafana. Used together, they give you logs and traces linked with your metrics, much like Datadog’s suite.
Elastic Stack (Elasticsearch / Logstash / Kibana or OpenSearch)

The Elastic Stack (ELK) is a mature open-source solution for logs and metrics analytics. Elasticsearch is a scalable search and analytics engine that, with Kibana, provides rich dashboards. It can handle massive data volumes in real time. (Amazon’s fork, OpenSearch, is also open-source.) Using ELK (or OpenSearch), you manage your cluster and pay no SaaS fees, at the cost of setup/operational work.
SigNoz
.webp)
SigNoz is a newer open-source observability platform designed as a drop-in DataDog/New Relic replacement. It is native to OpenTelemetry and provides end-to-end tracing, metrics dashboards, and log management in one UI. SigNoz offers pre-built dashboards and alerts, and integrates traces with metrics (click a graph point to view traces). Crucially, SigNoz is free to self-host (open-source), so you only pay for your own compute/storage.
Zabbix

A mature, enterprise-grade monitoring suite. Zabbix monitors networks, servers, VMs, and cloud resources via agents or agentless checks. It can easily scale to tens of thousands of devices and automatically discovers new hosts. Zabbix excels in infrastructure monitoring at a very large scale. It has a web UI for dashboards and alerts, and because it’s open-source, you can customize it extensively for free. (Its visuals are simpler than Datadog’s, but it’s proven in many big environments.)
Netdata

A lightweight, real-time monitoring agent and dashboard, focused on high-resolution (per-second) metrics. Netdata is open-source and designed to run on each host, streaming metrics to a central server or the Netdata Cloud. It’s easy to set up and offers very granular live views, though it’s mostly for infrastructure (and lacks built-in distributed tracing).
Each of these open-source options requires effort to configure and host, but they cost little or nothing in licensing fees. For example, Prometheus/Grafana and Zabbix require only standard servers and no per-host charges. SigNoz itself is free to use on your hardware (SigNoz Cloud is a paid managed offering). By contrast, commercial platforms like Datadog often bill per host or per data volume, which can skyrocket as you scale. Using open tools is one of the clearest datadog free alternatives because you avoid usage fees entirely.
Cloud-Native Monitoring (AWS, Azure, Google)
If your workloads live in a public cloud, consider the cloud provider’s native monitoring service:
AWS CloudWatch
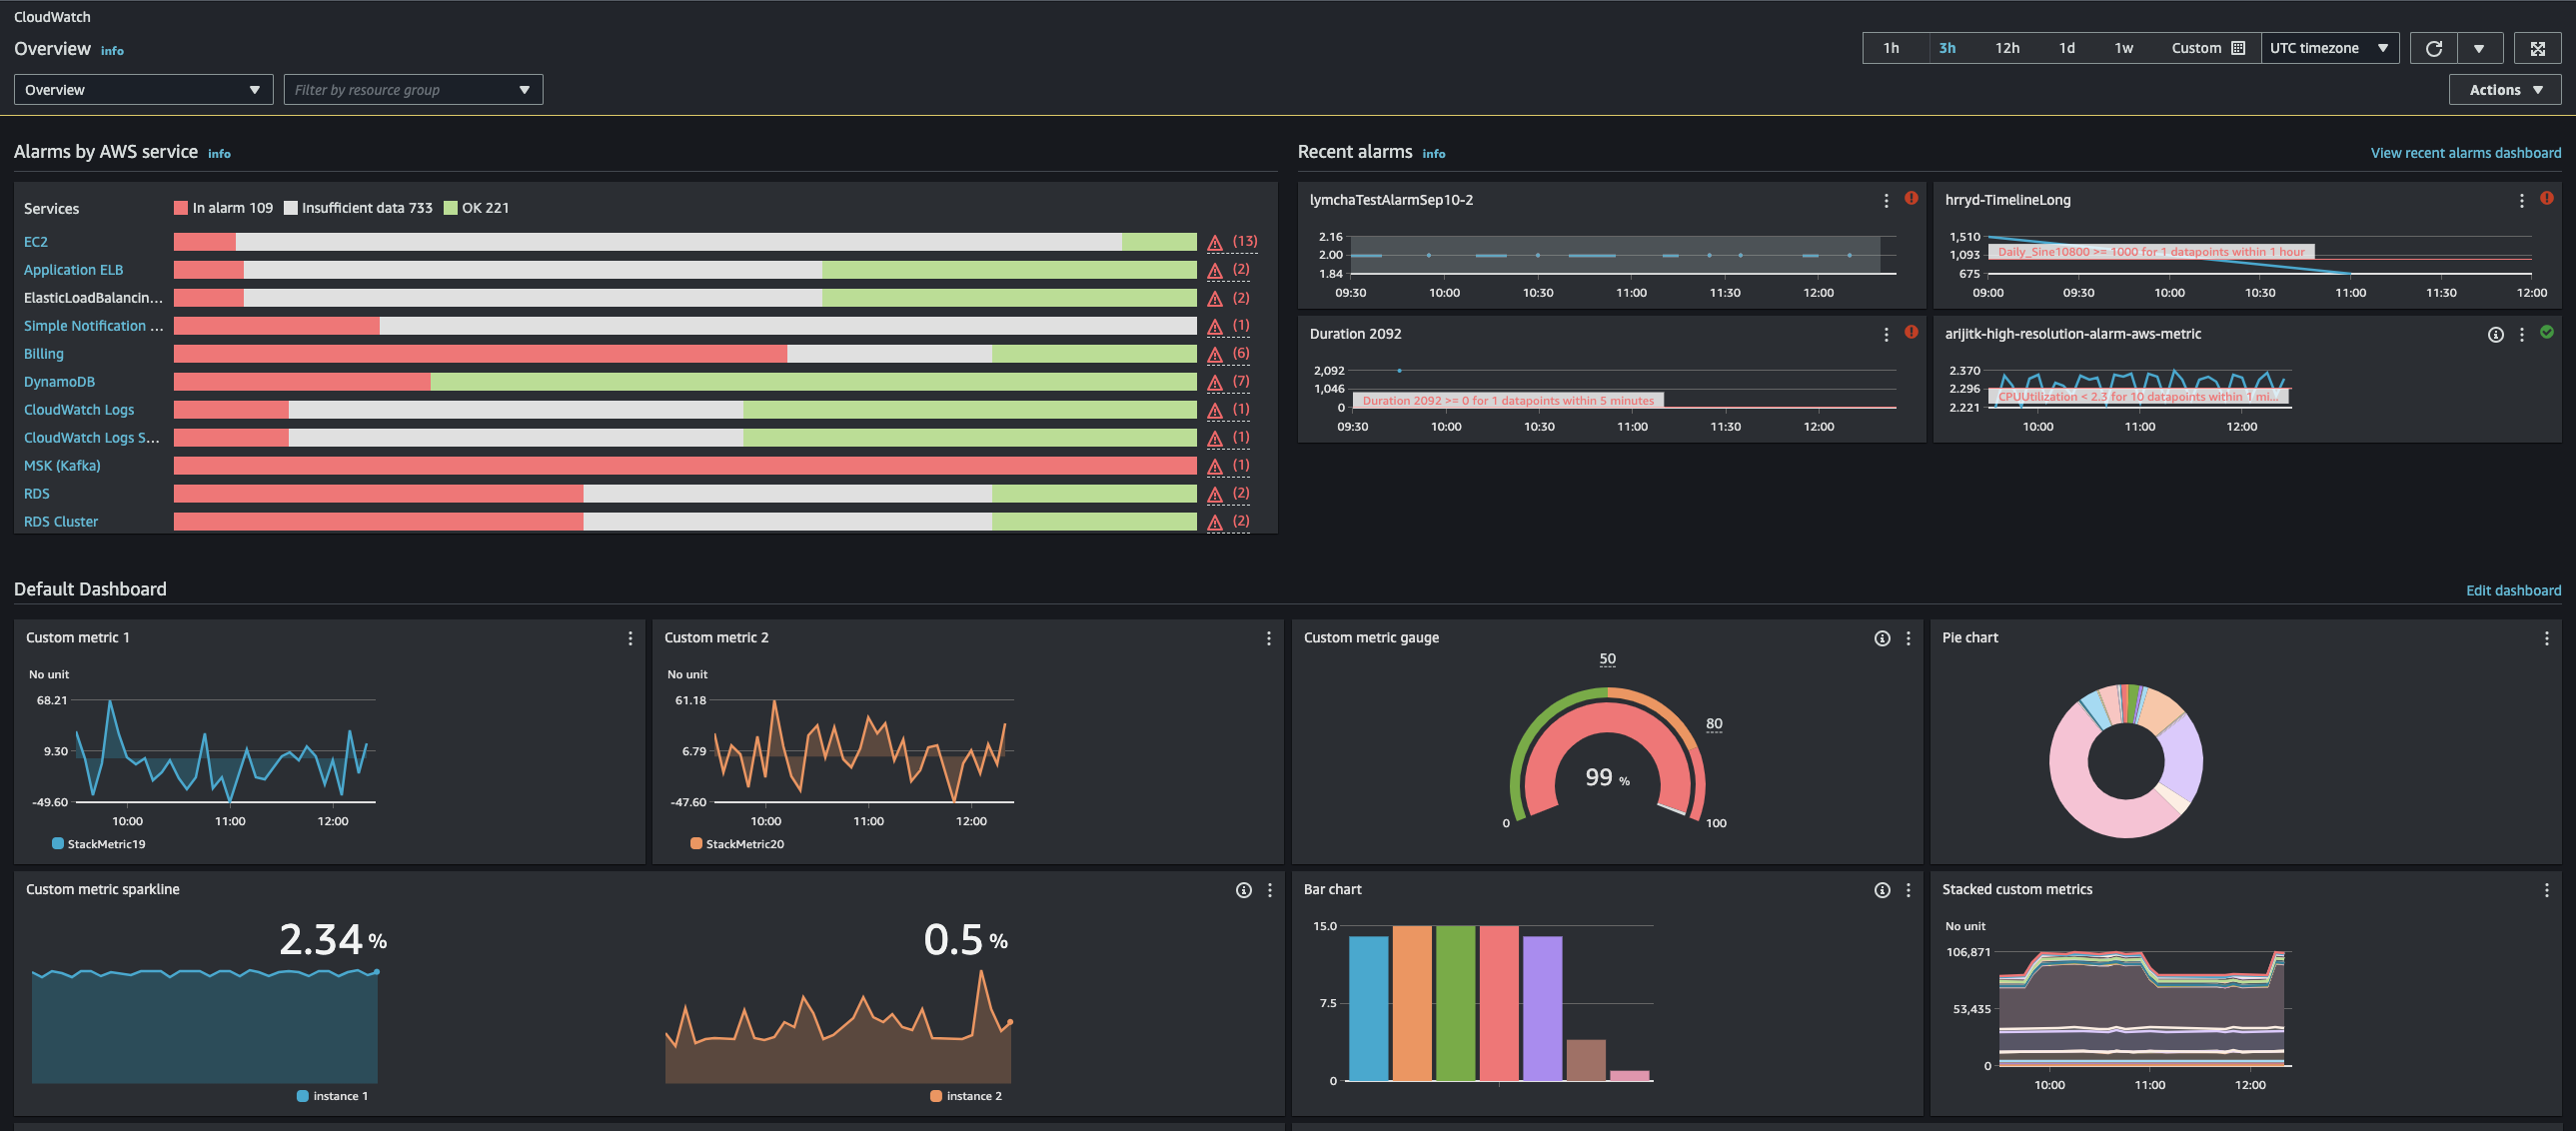
Amazon’s built-in monitoring for AWS resources (EC2, RDS, Lambda, etc.) and on-prem via agents. CloudWatch collects metrics, logs, and events, and lets you set alarms and dashboards. It integrates with over 70 AWS services out of the box. CloudWatch has a free tier (e.g. 10 custom metrics and alarms per month ), then uses pay-as-you-go billing based on metrics and logs ingested. It’s a natural choice for AWS-centric environments, though its UI and features differ from Datadog. (Datadog can also ingest CloudWatch metrics, but using CloudWatch directly avoids Datadog fees.)
Azure Monitor

Microsoft’s observability suite for Azure and hybrid environments. Azure Monitor “is a comprehensive monitoring solution for collecting, analyzing, and responding to monitoring data from your cloud and on-premises environments.” It gathers metrics, logs, and traces across applications, VMs, containers (including built-in Prometheus support), and more. Data is stored in a common platform for analysis. Azure Monitor pricing is pay-as-you-go (you pay for data ingestion, retention, and alerts). For organizations invested in Azure, it provides deep integration and a unified view. (It also includes Application Insights for APM.)
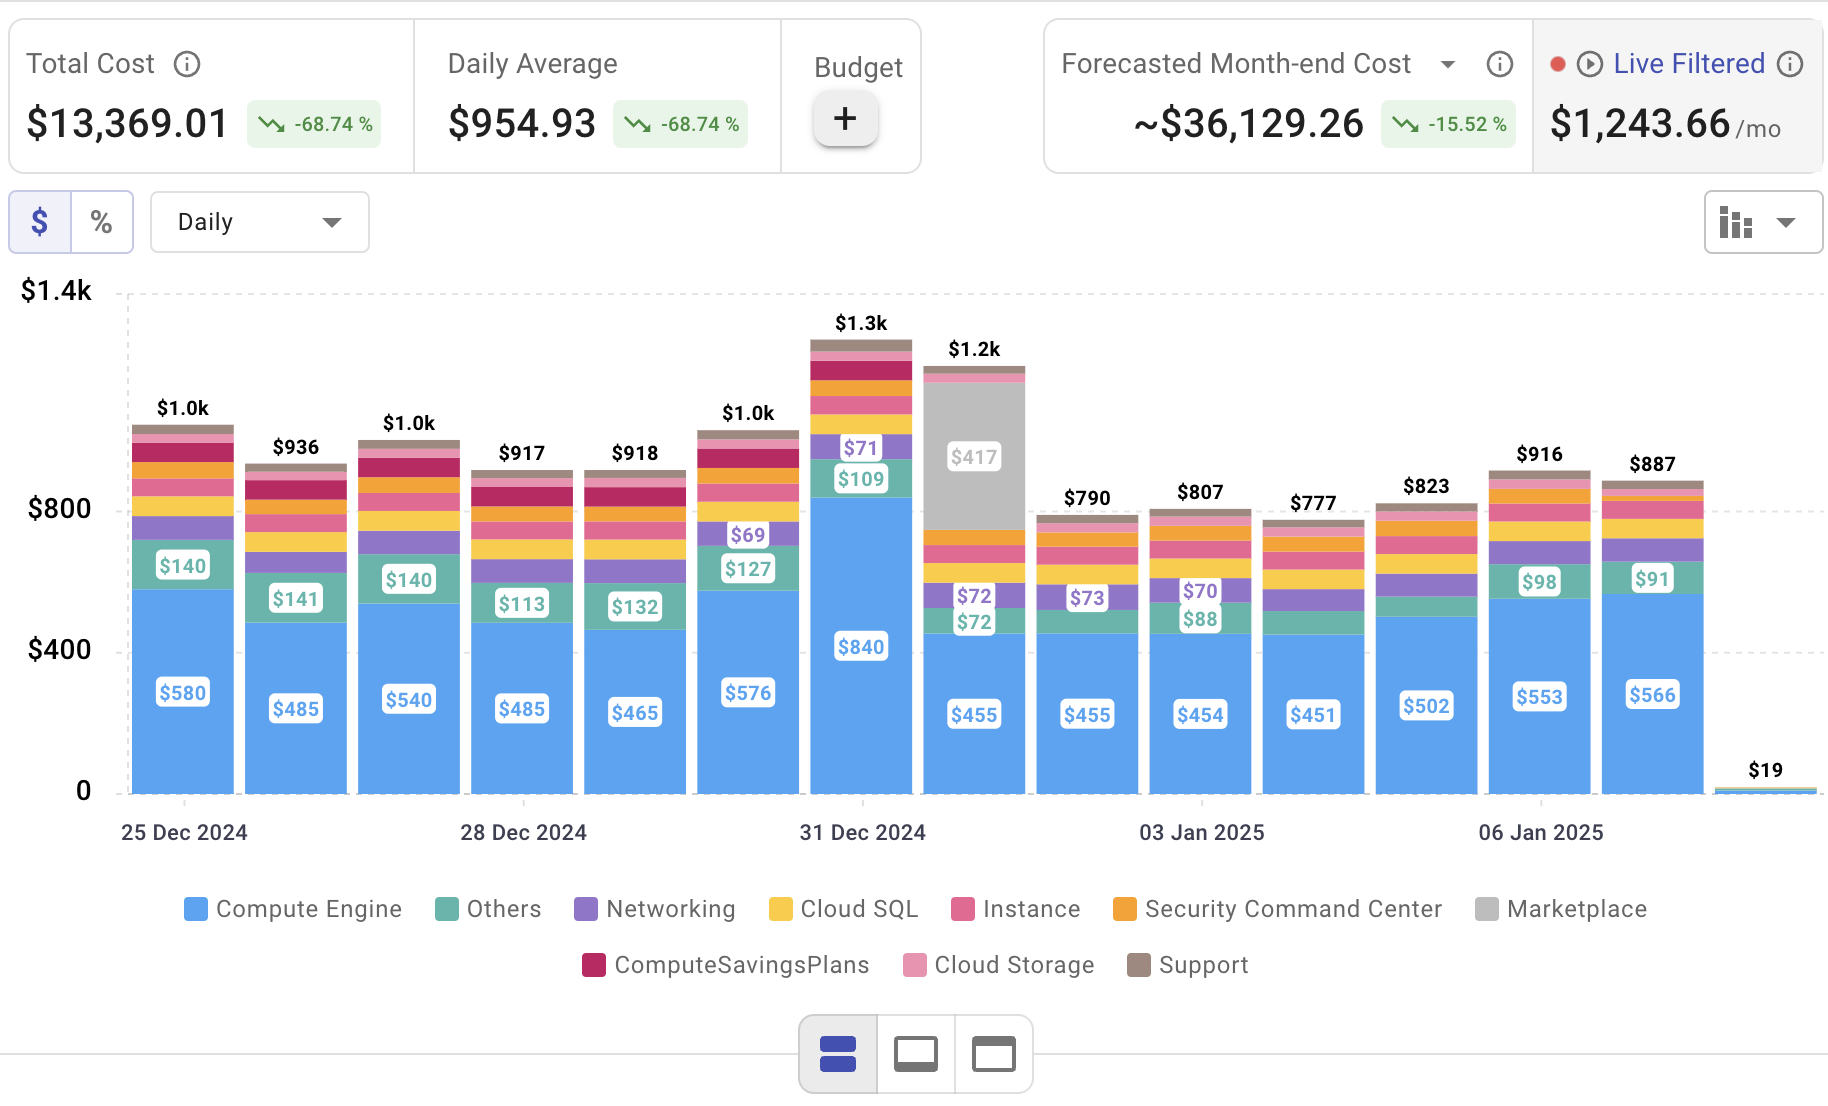
Google Cloud Monitoring (Operations)
GCP’s integrated monitoring/logging/tracing service (formerly Stackdriver). It collects system and custom metrics, log-based metrics, and even Prometheus-formatted metrics via Google’s Managed Service for Prometheus. Cloud Monitoring is tightly integrated with other Google Cloud services, and can visualize and alert on data from hybrid and multi-cloud via resource groups and scopes. GCP offers free quotas for monitoring data similar to AWS and Azure. Like CloudWatch, Google’s tool is best if you run mostly on the Google Cloud.
Using a cloud-native monitoring service is often cheapest if you’re fully on that cloud, since it leverages built-in agents and may have a generous free tier. For example, AWS’s free tier includes 10 custom metrics and 1,000,000 API requests per month. Azure and Google have similar allowances. However, cloud tools can lack the multi-cloud features and unified UI that third-party platforms (like Datadog) provide. Many teams use a hybrid approach: e.g. combine CloudWatch (metrics) with Grafana (dashboards) for AWS environments, or ingest Azure/Google data into an open system.
Enterprise Observability Platforms
Several commercial vendors compete directly with Datadog, offering unified monitoring and APM. These are typically chosen by large organizations that need advanced features and support. Notable alternatives include:
Dynatrace

A full-stack SaaS observability platform. Dynatrace uses causal AI (“Davis AI”) for anomaly detection and root-cause analysis, reducing manual effort . Like Datadog, it offers infrastructure monitoring, APM, log and UX monitoring in one pane. It is often praised for automatic discovery and enterprise scalability . (Dynatrace’s pricing is consumption-based and can get complex, but it’s very powerful for cloud-native and hybrid workloads.)
New Relic

A well-known observability suite that covers metrics, APM, logs, and more. New Relic now has usage-based pricing and includes a substantial free tier (e.g. up to 100 GB/month of data ingest at no charge). It offers many features similar to Datadog’s, including custom dashboards and alerts, but some users find its UI overwhelming. New Relic is popular in enterprises, though it is often rated as expensive beyond the free quota.
AppDynamics (Cisco)
An application performance management (APM) solution with strong code-level diagnostics. Cisco’s AppDynamics provides unified observability (metrics, logs, traces) and is known for deep transaction tracing and real-user monitoring. One review notes it’s “an all-in-one observability platform similar to Datadog” (supporting metrics, logs, traces). It tends to be used in large organizations, and pricing can be by application tier or infrastructure units.
IBM Instana

A real-time observability tool focusing on microservices and APM. Instana automatically discovers applications and traces every transaction, giving second-by-second data. It includes infrastructure monitoring and AI-driven insights. IBM’s site notes Instana “offers comprehensive monitoring across mobile, web, apps, and (cloud and on-premises) infrastructure.”. It has per-host pricing (as Datadog does).
Splunk Observability Cloud (SignalFx)
Splunk offers an integrated platform for logs (Splunk Enterprise) and newer services for metrics (SignalFx) and APM. It can replace the ELK+Datadog stack with one vendor, especially if you already use Splunk for logging. Splunk’s pricing is typically usage-based (data volume) and can be high for large loads.
Sumo Logic, SolarWinds, LogicMonitor, Sematext
There are numerous other SaaS tools in this space. Many focus on specific niches (e.g. Sumo Logic on logs, SolarWinds on network devices, Sematext on logs + APM), but some offer broad observability as well. These options usually have free trials or limited free versions, but most become paid as you scale.
These enterprise tools vary widely in cost and features. They often provide turnkey solutions (agents and dashboards) and advanced capabilities like synthetic monitoring, network insights, or security analytics. As a rule of thumb, the more comprehensive the feature set (and brand name), the higher the price. For example, some reviews note that Dynatrace and New Relic are “expensive and only suited for large corporations” (albeit very powerful) , whereas open-source stacks scale without licensing costs. If your team prefers SaaS over self-hosting and needs vendor support, these platforms are worth evaluating.
Choosing the Right Tool
Use cases
Start by listing your monitoring needs. Do you need full APM (code-level tracing), or just metrics and logs? Are you cloud-native (Kubernetes, microservices) or on-prem? Do you need synthetic/real-user monitoring? For example, Prometheus+Grafana excels for container metrics and custom dashboards, while ELK or Splunk shine for log analytics. If you’re in AWS, CloudWatch might cover basic needs at a low cost. An e-commerce team might prioritize real user monitoring and error tracking (for which Datadog, New Relic, or Grafana with network plugins could help), while an infrastructure team might just need host and network monitoring (Zabbix, Nagios, CloudWatch, etc.). Many organizations end up using a hybrid approach: e.g. Prometheus for metrics, Grafana for dashboards, plus Elasticsearch for logs, or combining a free tier of Grafana Cloud with SigNoz on-prem.
Pricing
Consider total cost of ownership. Open-source tools (Prometheus, Grafana, Zabbix, Elastic, SigNoz, etc.) are free to use, but you pay in sysadmin effort and hardware. Datadog and peers typically charge per host, per custom metric, or per GB of logs. These costs can quickly add up with more hosts or noisy apps. For example, Datadog’s custom metrics charge (e.g. $5 per 100 custom metrics in one account ) can surprise customers. In comparison, Grafana Cloud was found to be “often significantly more affordable” for large-scale monitoring. Likewise, AWS CloudWatch’s usage fees may be modest if you have a lot of AWS-only workloads; AWS even includes 10 metrics free in its free tier. Azure Monitor and Google Cloud Monitoring charge based on data volume, with free quotas to start. Commercial tools like New Relic may offer a large free allowance (e.g. 100GB/month free) before billing kicks in.
Conclusion
Datadog alternatives open source options abound if you’re willing to self-manage, and they can greatly reduce costs and vendor lock-in. For paid options, match the pricing model to your workload profile. The best choice depends on your environment and priorities: open-source freedom vs. turnkey convenience, data volume vs. budget, and the specific monitoring features you need. By considering the tools above and aligning them with your use cases and budget, you can find a Datadog alternative that fits your team’s needs.
Optimize Your Cloud Costs with Cloudchipr
Rolling out an observability stack is easy—keeping costs from ballooning isn’t. Cloudchipr unifies AWS, Azure, GCP, and Datadog spend in a single view, flags bloated metric, log, and trace pipelines, and reveals concrete savings across infrastructure and storage. Stop waste early and make every monitoring dollar count.
Key Features of Cloudchipr
Automated Resource Management:
Easily identify and eliminate idle or underused resources with no-code automation workflows. This ensures you minimize unnecessary spending while keeping your cloud environment efficient.
Receive actionable, data-backed advice on the best instance sizes, storage setups, and compute resources. This enables you to achieve optimal performance without exceeding your budget.
Keep track of your Reserved Instances and Savings Plans to maximize their use.
Monitor real-time usage and performance metrics across AWS, Azure, and GCP. Quickly identify inefficiencies and make proactive adjustments, enhancing your infrastructure.
Take advantage of Cloudchipr’s on-demand, certified DevOps team that eliminates the hiring hassles and off-boarding worries. This service provides accelerated Day 1 setup through infrastructure as code, automated deployment pipelines, and robust monitoring. On Day 2, it ensures continuous operation with 24/7 support, proactive incident management, and tailored solutions to suit your organization’s unique needs. Integrating this service means you get the expertise needed to optimize not only your cloud costs but also your overall operational agility and resilience.