Getting Ready: DevOps Interview Questions You'll Likely Hear
Introduction
DevOps interviews are known to be challenging because they span a wide breadth of skills and knowledge. As Microsoft’s Donovan Brown famously said, “DevOps is the union of people, process, and products to enable continuous delivery of value to our end users.” In practice this means a DevOps engineer needs to understand everything from coding and automation to cloud infrastructure and team culture. Interviewers often ask common DevOps interview questions and answers that cover continuous integration (CI), continuous delivery/deployment (CD), infrastructure as code (IaC), monitoring, and DevOps culture, all in one conversation. It’s a lot to handle!
Why are DevOps interviews so tough? Unlike narrow technical roles, DevOps positions demand familiarity with many tools and concepts. You’re expected to demonstrate technical depth and a grasp of big-picture principles like collaboration and metrics. In other words, DevOps has “upended the way enterprises approach software engineering” by emphasizing a culture where people from all disciplines work together to design, develop, deploy, and operate systems . This broad scope means interviews can jump from a deep dive into a CI/CD pipeline one minute to a discussion about team incident response practices the next.
What will you gain here? This guide distills a range of DevOps interview questions – from entry-level fundamentals to management-level strategy – and offers concise Q&A based on real expertise and research. We’ve integrated insights from high-authority sources (AWS, Google’s DORA research, Microsoft Azure, etc.) to ensure advice is up-to-date and credible. You’ll find:
- Core Concepts Q&A: covering DevOps basics like CI/CD, IaC, monitoring, culture, and metrics.
- Cloud-Specific Q&A: real-world scenarios for AWS and Azure – yes, we tackle those AWS DevOps interview questions and Azure DevOps interview questions you’re likely to face.
- Role-Specific Q&A: tailored questions for a mid-level DevOps Engineer, a Senior DevOps Engineer, and a DevOps Manager – because focus areas evolve as you advance in seniority.
- Hands-On Tasks (prepare.sh): examples of practical exercises (from the platform prepare.sh) that mirror real interview challenges, so you can practice doing, not just talking.
- Pro Tips: insider nuggets from experienced interviewers (inspired by an internal DevOps/SRE interview doc) highlighted throughout, to give you an extra edge in responses.
By the end, you should have a clear idea of what to expect in a DevOps interview and how to approach each question with confidence and clarity. Let’s dive in!
Core Concepts Q&A
In this section, we tackle fundamental DevOps technical interview questions that apply to almost any DevOps role. These questions focus on core concepts – the building blocks of DevOps knowledge – and are often used by interviewers to gauge your overall understanding of DevOps practices. Mastering these will help you handle the common DevOps interview questions that come up for all experience levels.
Q1: What is CI/CD and why is it important in DevOps?
A: CI/CD stands for Continuous Integration and Continuous Delivery/Deployment. In DevOps, CI/CD is a cornerstone practice that automates the software build, test, and deployment process:
- Continuous Integration (CI): Developers frequently merge code changes into a shared repository. Each merge triggers an automated build and test sequence to catch issues early. CI ensures that integration problems are detected immediately rather than weeks later. This leads to fewer integration bugs and a more stable codebase.
- Continuous Delivery (CD): Every change that passes the CI pipeline is packaged and made ready for deployment. Continuous Delivery means you could deploy to production at any time with the push of a button, because your code is always in a deployable state (thanks to automated testing and integration).
- Continuous Deployment (also CD): This takes Continuous Delivery one step further – code that passes all automated tests is automatically deployed to production without manual intervention.
CI/CD is important because it enables frequent, reliable releases. By automating builds, tests, and deployments, teams reduce manual errors and deliver updates faster to users. This aligns exactly with the DevOps goal of delivering value continuously (remember Donovan Brown’s quote about delivering value). In fact, industry research shows that high-performing DevOps teams utilize CI/CD to achieve faster and more stable releases. For example, Amazon’s own engineering library emphasizes that from integration through deployment and observability, following CI/CD best practices produces “robust and scalable DevOps workflows that facilitate rapid software delivery and smooth operations.” In short, CI/CD is the engine that drives DevOps agility.
Continuous delivery ensures every build is ready for production release, while continuous deployment automates releasing every change that passes tests into production.
Q2: Infrastructure as Code (IaC) – what is it and what are its benefits?
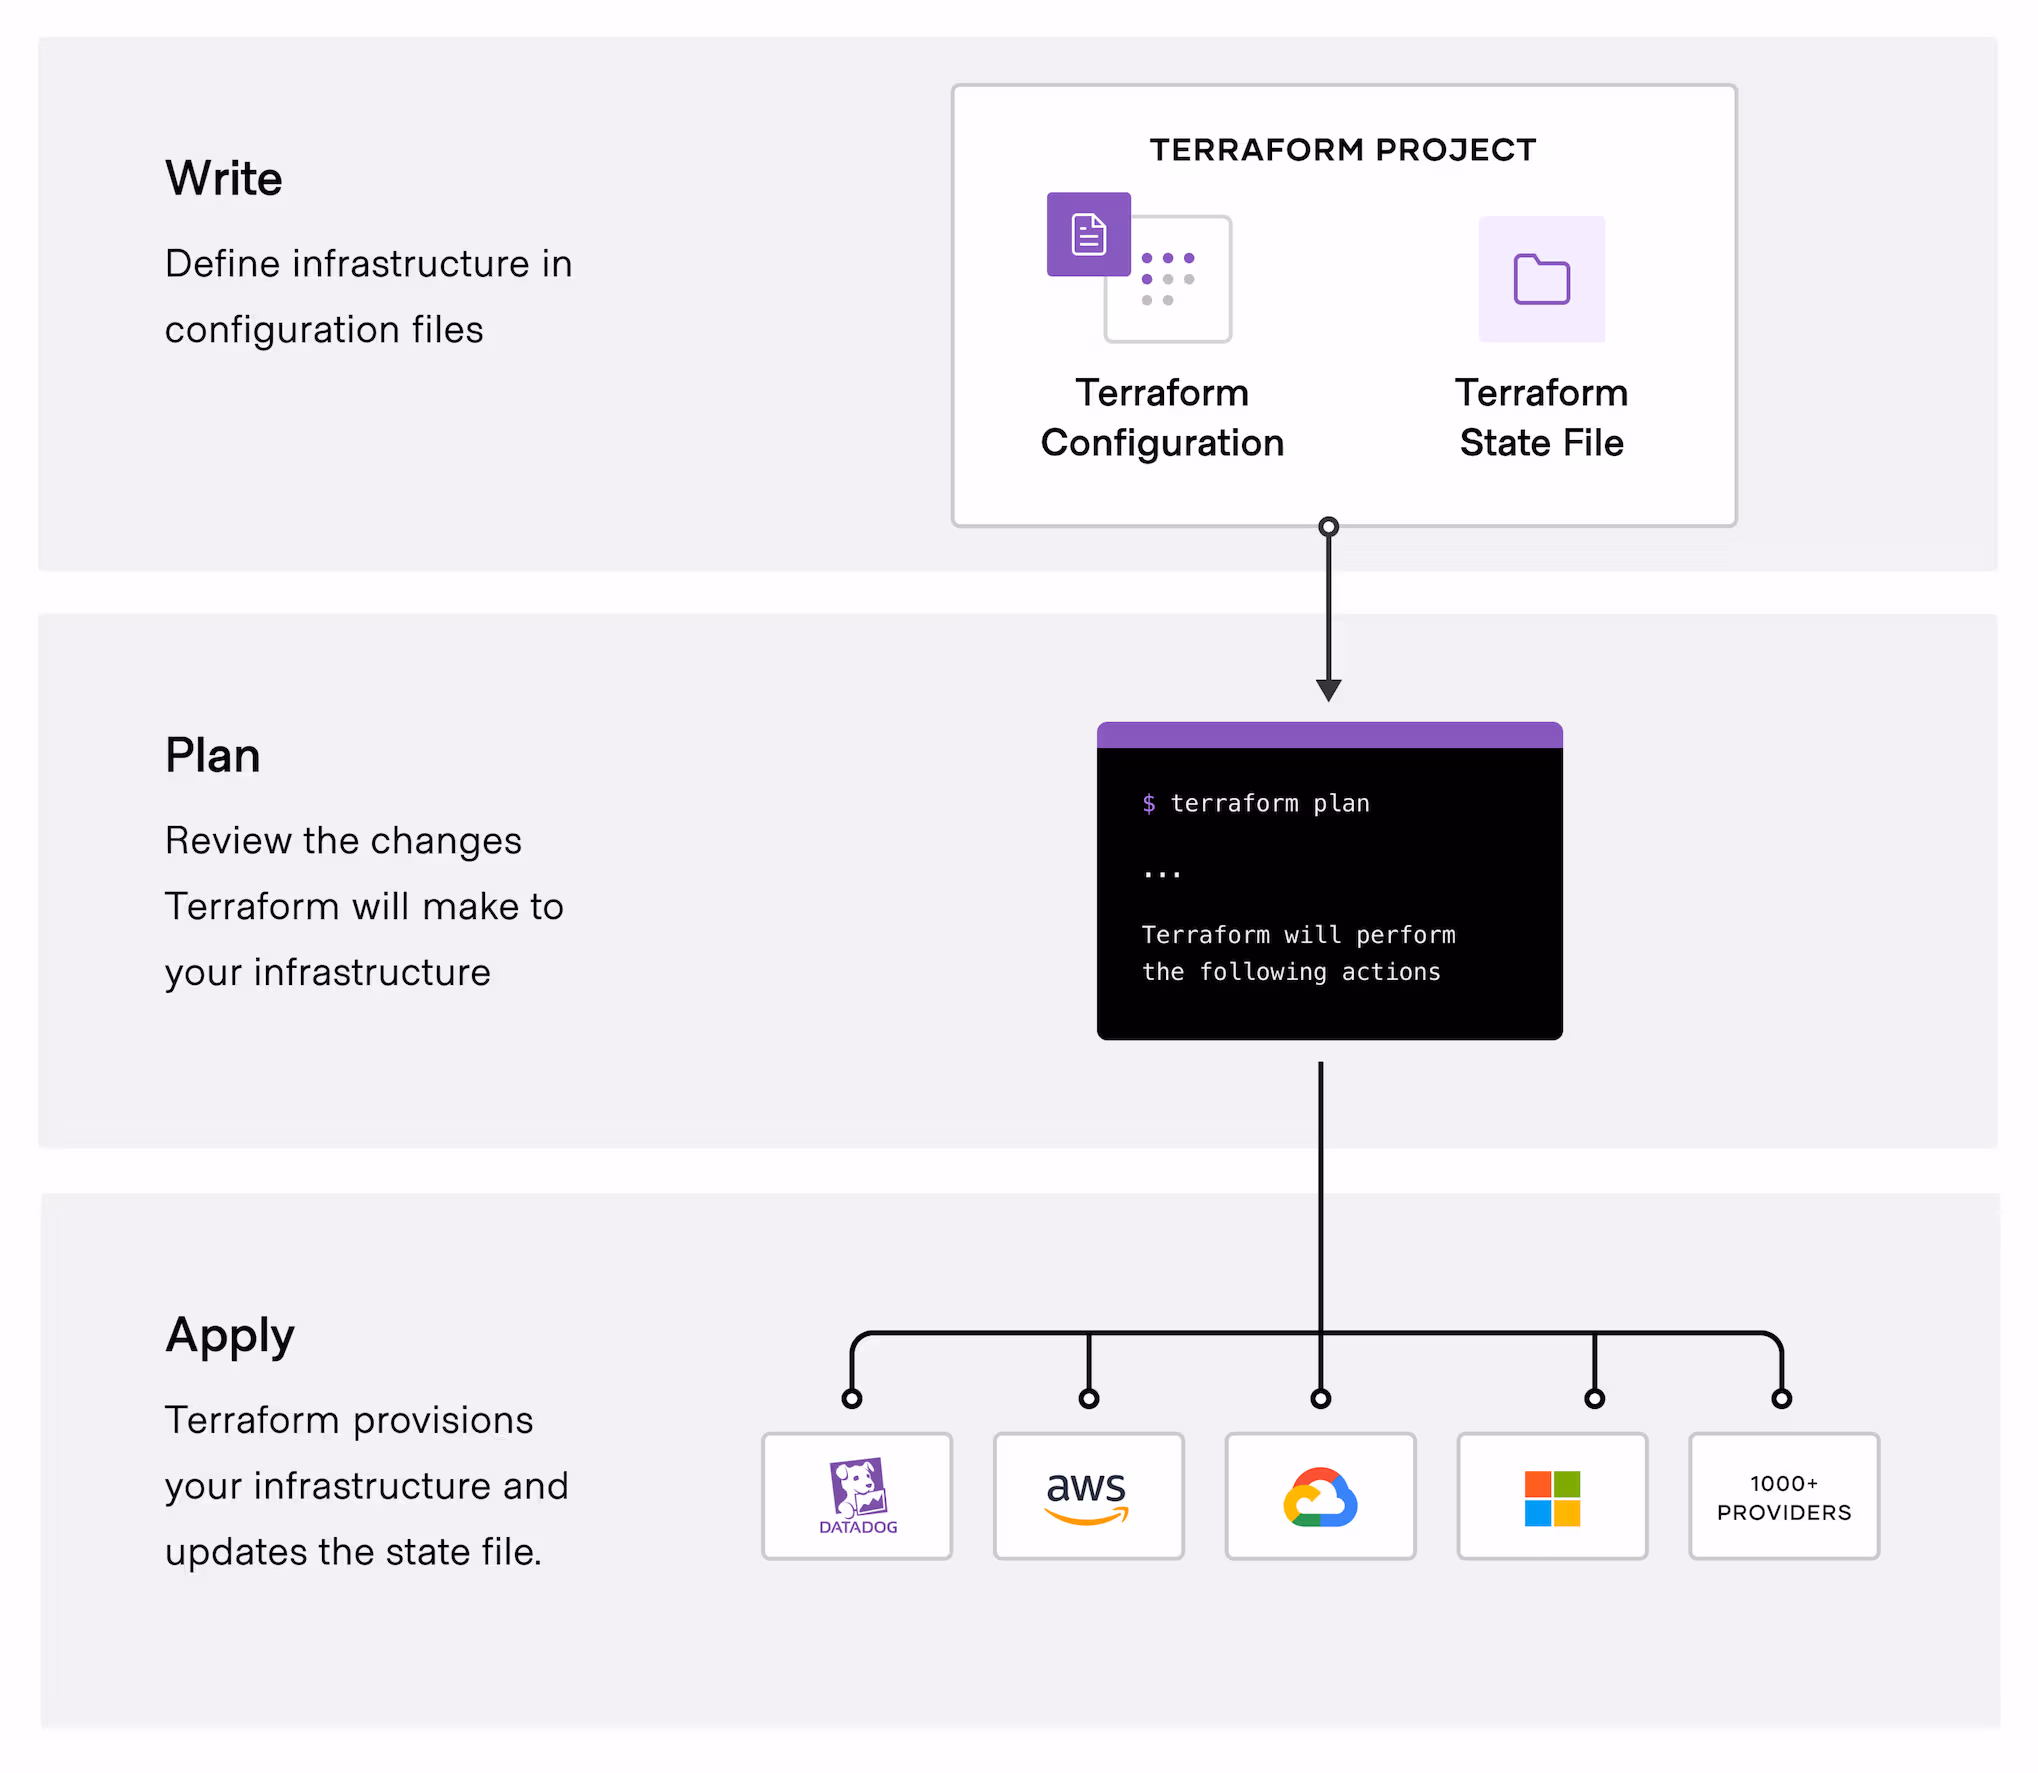
A: Infrastructure as Code (IaC) means managing and provisioning your IT infrastructure (servers, networks, databases, etc.) using machine-readable definition files (code), rather than manual processes or one-off scripts. In practice, you use declarative templates or scripts (e.g., Terraform, AWS CloudFormation, Ansible, or Azure Bicep templates) to define the infrastructure you need. This code is stored in source control just like application code.
Benefits of IaC:
- Consistency and Repeatability: IaC ensures that you create the same environment every time you deploy. If you spin up a staging environment today and another one next week from the same code, they will be virtually identical.
- Automation and Speed: Provisioning and configuring infrastructure become automated processes. With a single command, you can create dozens of resources. This drastically speeds up environment setup and tear-down, which is especially useful in Dev/Test scenarios or auto-scaling.
- Version Control and Auditability: Because your infrastructure is defined as code, you can version it in Git. You gain history and traceability for infrastructure changes. Rollbacks are easier (you can roll back to a previous stable version of your infra code). Code review practices can be applied to infrastructure changes, increasing quality and peer oversight.
- Scalability and Efficiency: IaC allows you to manage large-scale environments. For example, if you need to deploy the same stack to multiple regions or accounts, you can reuse the code.
- Reduced Configuration Drift: Because all changes go through code, your documentation and reality don’t diverge. What’s in your config code is exactly what’s deployed. Tools can even verify the real infrastructure matches the code (drift detection).
In summary, IaC treats infrastructure as a part of the software system. This is crucial in DevOps because it brings the same thoroughness of software development (testing, code review, CI/CD) to infrastructure changes.
Q3: How do you approach monitoring and logging in a DevOps context?
A: Monitoring and logging are critical to the “Ops” side of DevOps, ensuring you know what’s happening in your systems and can respond quickly to issues. A strong answer will cover both monitoring (metrics, alerts) and logging (system/application logs, tracing) and tie them to continuous improvement.
Key points to mention:
- Collect Metrics: You should monitor key metrics from applications and infrastructure – e.g. CPU/memory usage, request rates, error rates, latency, etc. In cloud environments you might use tools like Amazon CloudWatch, Azure Monitor, or Prometheus to scrape metrics. These metrics feed dashboards and alert systems. Mention that setting up thresholds or anomaly detection on these metrics allows the team to get proactive alerts (e.g., if error rate or response time exceeds a certain limit, on-call engineers are notified).
- Centralized Logging: Instead of manually checking logs on individual servers, DevOps teams centralize logs. Tools like the ELK stack (Elasticsearch/Logstash/Kibana), Splunk, or cloud services (e.g., CloudWatch Logs, Azure Log Analytics) aggregate logs from all services. This makes it easier to search logs for specific errors or trace through a sequence of events. It’s especially useful in microservices environments – you can follow a user request across service boundaries if you have good correlated logs or tracing.
- Tracing and Observability: For modern distributed systems, mention distributed tracing (using tools like Jaeger or Zipkin, or AWS X-Ray/AppDynamics/Datadog) to track requests across multiple services. Observability means you have the data (logs, metrics, traces) to ask any question about your system’s behavior. It’s a level up from basic monitoring.
- Alerting and Incident Response: Explain that you would configure alerts on critical conditions (e.g. high error rate, downtime). Those alerts go to on-call engineers (via email, SMS, Slack, PagerDuty, etc.). Emphasize having runbooks or playbooks for common alerts so that issues can be resolved quickly. A DevOps culture encourages automating alert resolution where possible – for example, auto-scaling if CPU is high, or automatic restart of a service if it becomes unresponsive.
- Feedback into Development: This is often overlooked: monitoring isn’t just to react to incidents, but to provide feedback to improve the system. For instance, if you notice memory usage creeping up release after release, it could indicate a memory leak – developers can then prioritize a fix. Or if deployment frequency is slowing down due to flaky tests, that metric can trigger action. This idea of observability driving continuous improvement is central.
In a DevOps interview, you might add an example: “In our team, we used Prometheus and Grafana for monitoring microservices metrics and set up Slack alerts for high error rates. We also aggregated logs with ELK. This combination helped us reduce our Mean Time to Recovery (MTTR) because we could quickly pinpoint issues. For example, an alert once notified us of elevated latency – we checked Grafana and saw a specific database query was slow, then used logs to trace it to a missing index, which we fixed within an hour.” This shows you understand the end-to-end monitoring process and its value.
Q4: What DevOps metrics do you track to measure success?
A: DevOps success is often measured by key performance metrics that gauge software delivery performance and operational stability. The most famous set of metrics comes from the DORA research (DevOps Research and Assessment, now part of Google Cloud’s DORA State of DevOps Reports). According to DORA, there are four key metrics that indicate the performance of a software delivery team:
- Deployment Frequency: How often an organization successfully releases to production. High performers deploy far more frequently (on-demand, often multiple times per day) while lower performers might deploy only monthly or less. Frequent, small releases are generally healthier.
- Lead Time for Changes: The time it takes to go from code committed to code running in production. In other words, how quickly can you get a change through the pipeline. Elite teams measure this in minutes or hours, whereas low performers might take weeks. Shorter lead times mean faster feedback and value delivery.
- Change Failure Rate: The percentage of deployments that cause a failure in production (incident, rollback, etc.). This metric focuses on quality and stability. A low change failure rate (e.g., <5%) is a sign of a healthy, well-tested release process. High performers manage to keep quality high even as they deploy faster.
- Mean Time to Recovery (MTTR): How long it takes to restore service when an incident occurs (or how long to rollback a bad release). Sometimes called “Failed Deployment Recovery Time” in newer reports, it measures resilience. The best teams recover in minutes; slower teams might take days. Lower MTTR means your ops practices (monitoring, on-call, rollbacks) are effective.
Citing these four metrics by name impresses interviewers because it shows you’re aware of industry standards. In fact, DORA’s research correlates excellence in these metrics with high organizational performance. For example, teams with fast code review and deployment practices see up to 50% higher software delivery performance , and those with a generative DevOps culture (high trust, collaboration) have 30% higher organizational performance .
Beyond the “big four,” you can mention other metrics like availability/uptime, system throughput, or business-level metrics (e.g. customer ticket volume, time to onboard a new feature) depending on context. But most interviewers will appreciate hearing about the DORA metrics as a framework.
Q5: Describe the role of DevOps culture in a successful DevOps implementation.
A: DevOps culture is often what separates high-performing teams from the rest. It’s not just about tools; it’s about people and how they work together. A good answer should highlight collaboration, shared responsibility, and continuous learning:
- Collaboration and Breaking Silos: DevOps originally emerged to break down the wall between Development and Operations teams. A DevOps culture encourages devs, ops, QA, security – everyone involved in delivering software – to work together closely, rather than throwing work over organizational silos. This might involve cross-functional teams or at least lots of communication and joint planning. The motto is “You build it, you run it,” meaning developers take ownership of running their code in production, and ops folks get involved earlier in the development process.
- Blameless Post-Mortems and Continuous Improvement: When failures happen, DevOps cultures avoid blame games. Instead, they do blameless retrospectives or post-mortems to understand the root causes (often systemic issues, not individual negligence) and implement improvements. This fosters a safe environment where team members aren’t afraid to surface problems or admit mistakes – crucial for learning and improving.
- Shared Responsibility: In a DevOps culture, success is measured at the team or organization level, not just individual performance. Developers care about deployment and uptime; operations cares about enabling rapid change. Everyone is responsible for the end result (delighting the customer with reliable software). This is sometimes facilitated by practices like developers being on-call for their services, or ops pairing with devs during development.
- Automation and Experimentation: Culturally, DevOps teams value automation of repetitive tasks (freeing humans to do creative work). They also embrace experimentation – trying new tools or approaches in small increments, learning from failures, and iterating. This ties into Agile principles too.
- Transparency and Information Flow: High-performing DevOps organizations are often very transparent. Information flows freely between teams. According to the 2023 State of DevOps report, when information is easy to find and share, teams see better software delivery and reduced burnout . Open communication and visibility (through dashboards, chatOps, etc.) are cultural norms.
You can reinforce your points with research: A generative, high-trust culture is strongly linked to better performance. DORA’s studies classify cultures using the Westrum model (pathological, bureaucratic, generative). Generative (high cooperation) cultures have 30% higher organizational performance than low-trust cultures. Also, such a culture improves employee well-being (less burnout, higher job satisfaction) which is essential for sustained high performance.
When answering, it’s great to give a personal anecdote: “In my experience, the technical stuff is easier to fix than the cultural stuff. On one project, we found that simply scheduling a weekly ops-dev huddle to review issues and share knowledge broke down a lot of barriers. Deployments got smoother because ops had context on upcoming changes and devs learned from ops about writing better runbooks. It really proved to me that culture and communication are as important as any toolchain.”
Q6: How do you ensure security in DevOps pipelines (DevSecOps)?
A: Security is a vital part of DevOps – hence “DevSecOps.” Ensuring security in pipelines means integrating security checks and practices throughout the software delivery process without slowing it down too much. Key strategies:
- Shift Security Left: Emphasize that you incorporate security early in the development cycle. This could mean running static application security testing (SAST) tools on your code as part of CI (to catch vulnerabilities or insecure code patterns), and doing dependency vulnerability scanning (using tools like OWASP Dependency Check, Snyk, or GitHub Dependabot) with each build. The idea is to find and fix issues before deployment.
- Automated Security Tests: In the CI/CD pipeline, include steps for security testing. For example, run container image scans (using tools like Clair or Trivy) to ensure no known vulnerabilities in the images you build. If your app has an API, maybe run DAST (Dynamic Application Security Testing) tools or even automated penetration testing scripts in a test environment.
- Infrastructure Security and Policies: If using IaC, you can have static analysis for IaC templates (e.g., Terraform plan scanners or Azure Resource Manager template analyzers) to detect misconfigurations (like open security groups, missing encryption). Many teams now use “policy as code” (tools like HashiCorp Sentinel or Open Policy Agent) to enforce security rules in pipelines. For instance, block deployments if certain rules aren’t met (e.g., every S3 bucket must have encryption enabled).
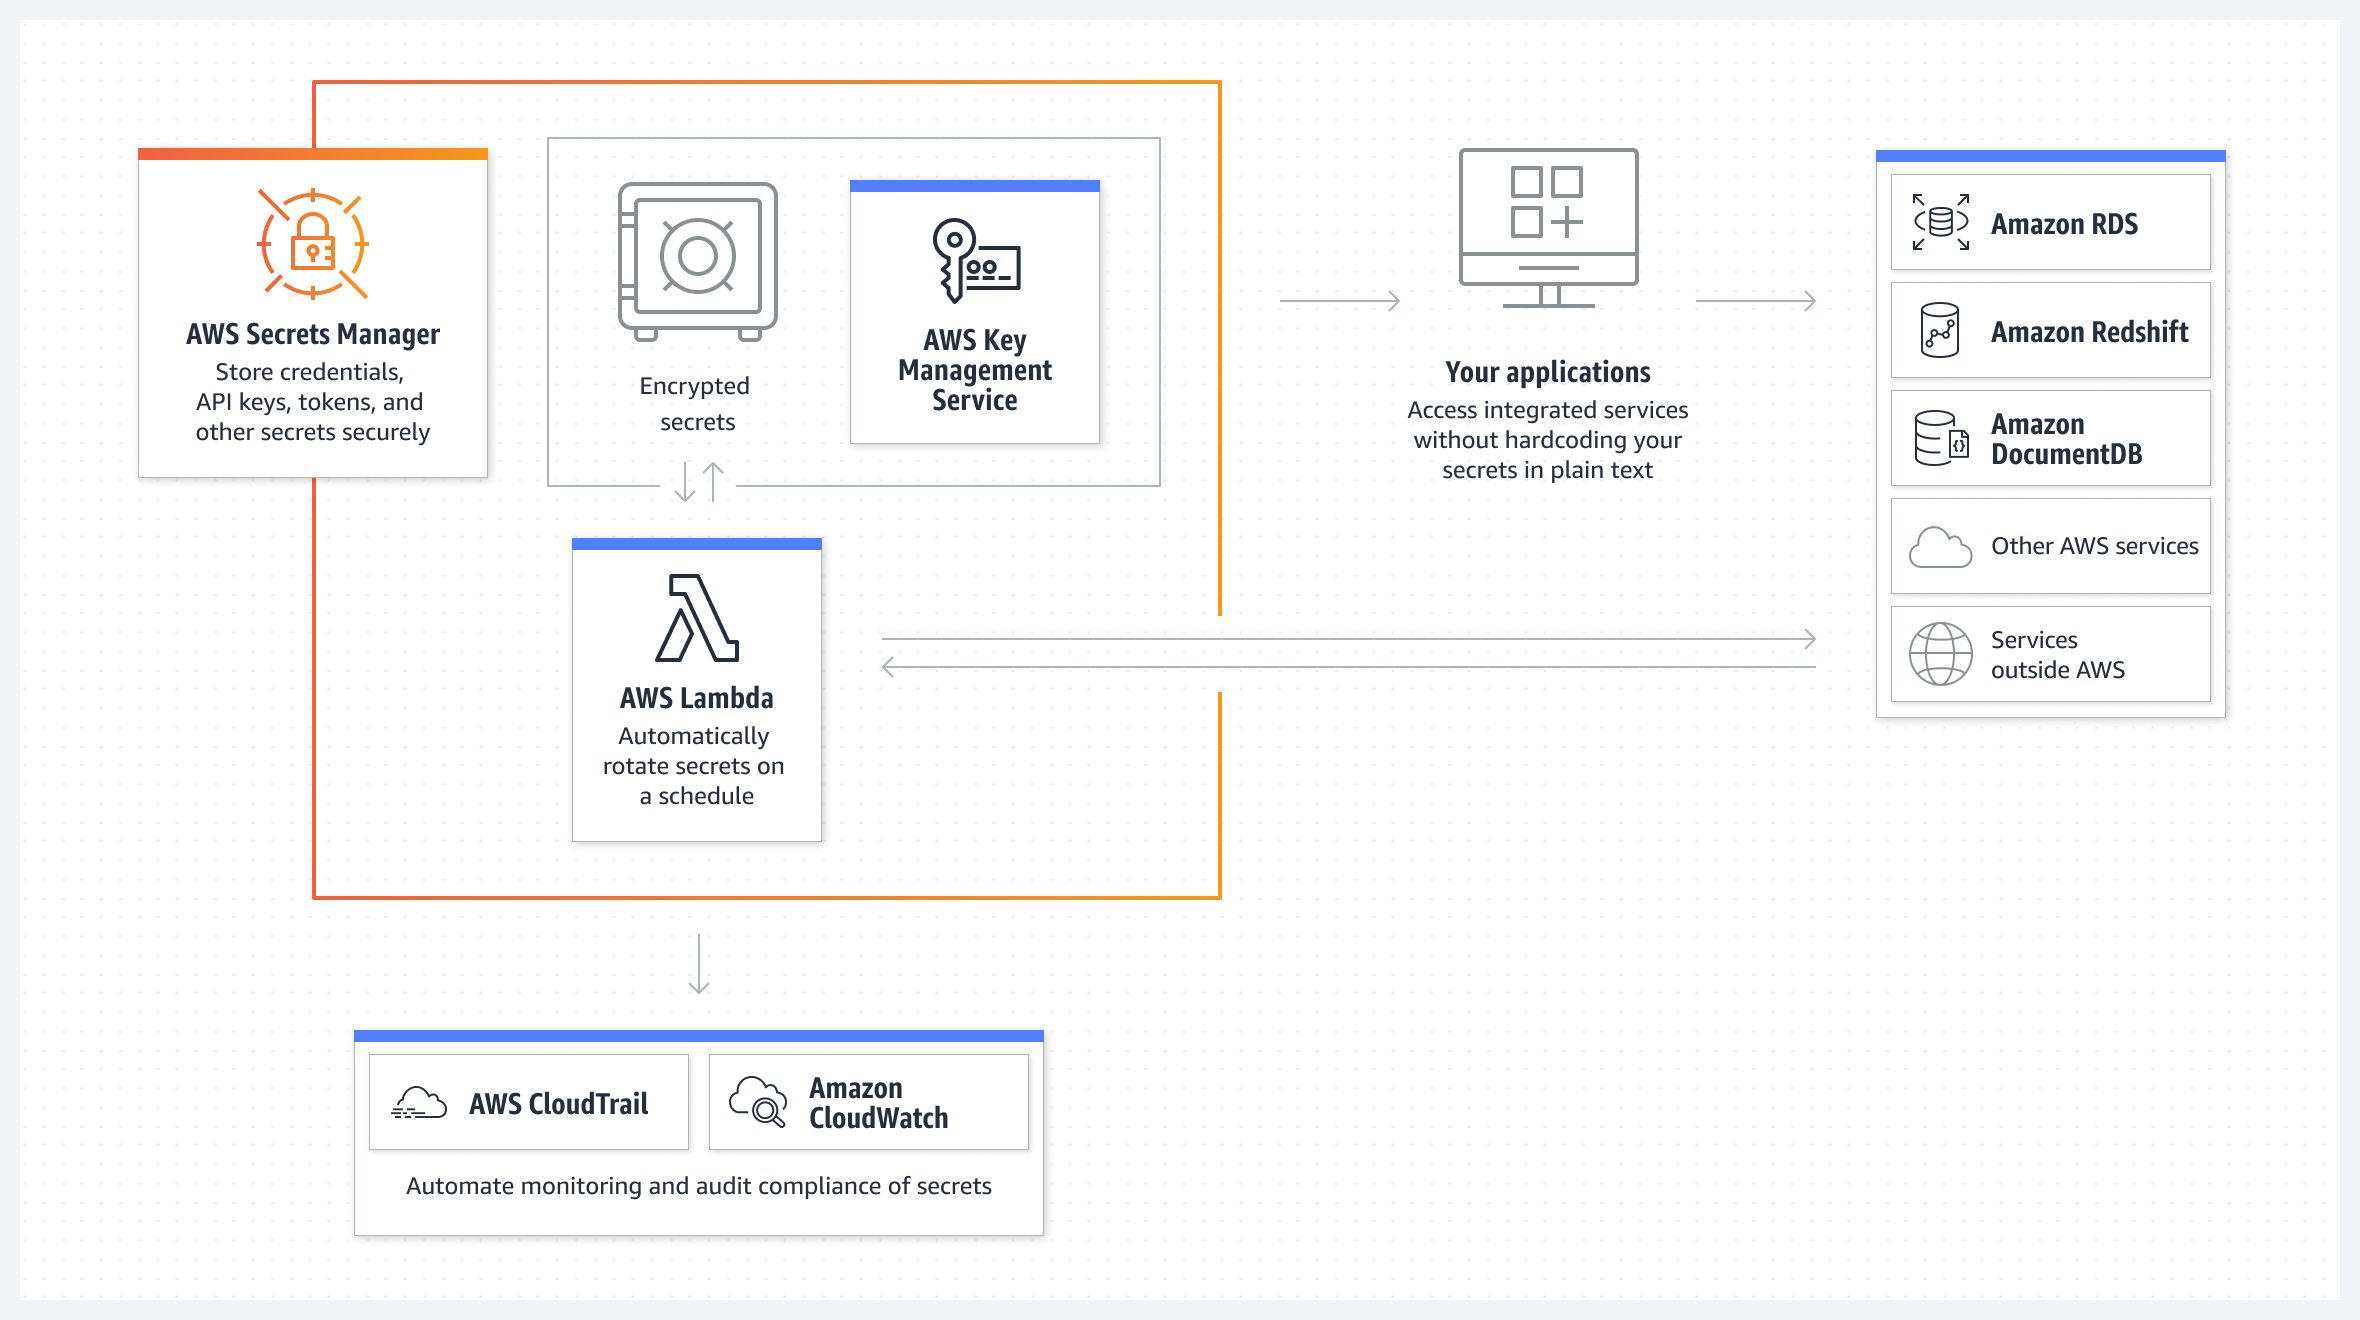
- Secrets Management: Never hard-code secrets (passwords, API keys) in pipelines or code. Talk about using secret management solutions like AWS Secrets Manager or Parameter Store, Azure Key Vault, or Vault by HashiCorp. In a pipeline, you fetch secrets at runtime from these secure vaults rather than storing them in plain text. This ensures that even if your code repo or CI/CD config is exposed, the secrets stay safe. Interviewers love to hear that you handle secrets properly.
- Access Control and Least Privilege: Ensure the pipeline itself and deployment processes run with minimal necessary permissions. For example, if your CI/CD system deploys infrastructure, use separate credentials with limited scope (like an AWS IAM role that can only deploy to specific resources). That way a compromised pipeline doesn’t mean total cloud compromise.
- Continuous Monitoring and Patching: Mention that DevOps doesn’t stop at deploy – you also ensure that you continuously patch dependencies and base images. Perhaps you have automated rebuilds of containers when a base image (like Ubuntu) has security fixes. Also, infrastructure as code allows automated patching of servers or rotation of credentials regularly.
In summary, integrating security in DevOps is about building a security pipeline inside your delivery pipeline. It’s often called “shifting left” and “building security in.”
You could add: “For example, in our Jenkins pipeline we added an open-source static code analyzer (Bandit for Python) and an OWASP ZAP scan stage. Initially it caught a lot of issues that failed the build, but we worked through them and then set a policy: any new critical vulnerability breaks the build. This gave developers fast feedback on security. Over time, security findings became rare and we had much higher confidence in our releases.” This demonstrates practical DevSecOps experience.
Q7: What is a Blue-Green Deployment (or Canary Release) and why would you use it?
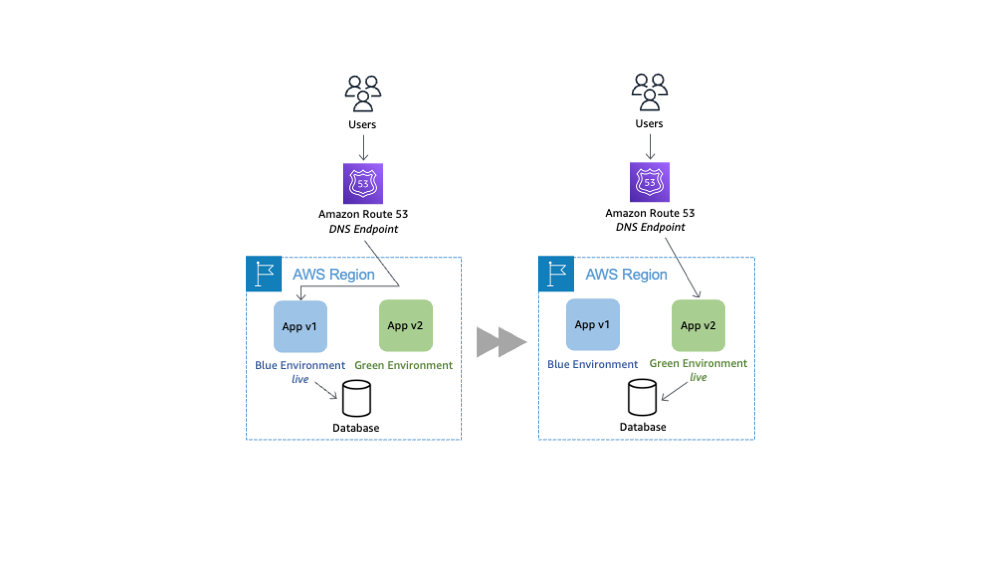
A: Blue-Green deployment is a release strategy that aims for zero downtime and easy rollback. You maintain two production environments as identical as possible: Blue (current live environment) and Green (new version). The steps are:
- Deploy the new version of your application to the Green environment while Blue is still serving production traffic.
- Once Green is fully deployed and tested (perhaps with some smoke tests or test traffic), you switch the production traffic to Green – this could be an update in your load balancer or DNS to point users to Green instead of Blue.
- Now Green is live. Blue is still running but idle (no traffic). If anything goes wrong with Green, you have a quick fallback: switch traffic back to Blue (the last known good version).
- If Green is running fine, you can eventually recycle or update Blue to become the next “staging” for the next release.
The benefit is zero (or minimal) downtime during releases and a very fast rollback plan. If a bug slipped through, you can reverse the switch in seconds to restore the old version.
Canary release is a variant where you gradually shift traffic to a new version. For example, you send 5% of users to the new version (Green) and 95% still to Blue. If metrics look good (no errors, etc.), you increase to 20%, then 50%, and eventually 100%. This way, you expose any issues on a small subset of users first. If something’s wrong, you only impact a small percentage and can quickly dial back to 0%.
Why use these? In DevOps, we strive for frequent deployments, but we also care about stability. Blue-Green and canary deployments reduce risk: they allow fast rollback and continuous delivery with confidence. They are especially common in environments where downtime is very costly or impossible (e.g., user-facing web services that need 24/7 availability).
If asked for how to implement, you can add cloud-specifics:
- In AWS, you might implement Blue-Green with Route 53 weighted DNS or using an Application Load Balancer to shift traffic between two target groups (one running blue, one green). AWS CodeDeploy actually has Blue-Green deployment support for EC2 and ECS deployments.
- In Kubernetes (common in DevOps), you might create two deployments (blue, green) and swap labels or use a service mesh or ingress controller with traffic splitting for canary style.
- In Azure, you can use deployment slots for Web Apps (the classic use: one slot is production, one is staging; swap when ready). Azure DevOps or pipelines can orchestrate slot swaps as part of release.
Mentioning an example shows understanding: “In a previous role, we containerized our app and used a Blue-Green deploy on Kubernetes. We had two sets of pods behind two services. At release time, we’d deploy the new pods (green) and then update the Ingress to send 100% traffic to green. If we found a severe bug, we could revert that Ingress change within a minute to go back to blue. It saved us on one occasion when a database migration caused issues – we rolled back to the old pods quickly and users barely noticed.”
Q8: What is one of the biggest challenges you’ve faced in a CI/CD pipeline, and how did you resolve it?
A: (This question is semi-open, often to gauge troubleshooting skills. It’s good to have a story ready.) A strong answer will recount a specific problem in a build/deploy pipeline and, importantly, how you identified and fixed it. For example:
“One big challenge I faced was a flaky test suite that made our CI pipeline unreliable. We had hundreds of tests, and occasionally one would fail in CI but pass on rerun, causing a lot of false alarms and slowing down deployments. To resolve it, I first added logging and alerts on test failures to gather data on which tests were flaky. We found a pattern that many of the flaky tests were related to timing issues (they didn’t wait properly for asynchronous processes). I collaborated with the dev team to fix those tests – we added proper synchronization and also improved some test data setup. We also implemented a retry mechanism in CI for any failed test – if it passed on second try, we flagged it as flaky and logged it for fixing, but didn’t fail the pipeline immediately. Over a few weeks, we drove down flaky failures significantly. The result was a much more reliable CI pipeline (our build success rate went from ~70% first-time to ~95% first-time). This meant developers trusted the pipeline more and were willing to merge code faster, improving our throughput.”
This answer shows problem-solving (identifying flaky tests), collaboration (with devs), and outcome (improved pipeline success rate). It’s okay if your challenge is different – e.g., integrating a new tool, optimizing pipeline speed, dealing with a stuck deployment, etc. The key is to show you can systematically tackle pipeline issues, which is a critical skill in DevOps engineering.
“We once had a production outage due to a misconfigured CI deployment script. After restoring service, I led a blameless post-mortem. We identified that the script didn’t properly handle a corner case and had no smoke tests. I wrote additional checks into the script and we added a post-deployment smoke test in the pipeline. We also documented the fix in our runbook.”
Those were some core DevOps concept questions. Next, let’s zoom into cloud-specific scenarios, because nearly every DevOps role today involves cloud platforms. Below, we’ll cover scenario-based Q&A for AWS and Azure, since many interview questions for DevOps roles focus on a candidate’s cloud experience.
AWS DevOps Q&A
When interviewing for roles involving Amazon Web Services, expect a number of AWS DevOps interview questions targeting how you implement DevOps practices on that platform. The following are common AWS scenarios with Q&A that highlight real-world use of AWS services in a DevOps context.
Q1: How would you build a CI/CD pipeline on AWS for a typical web application?
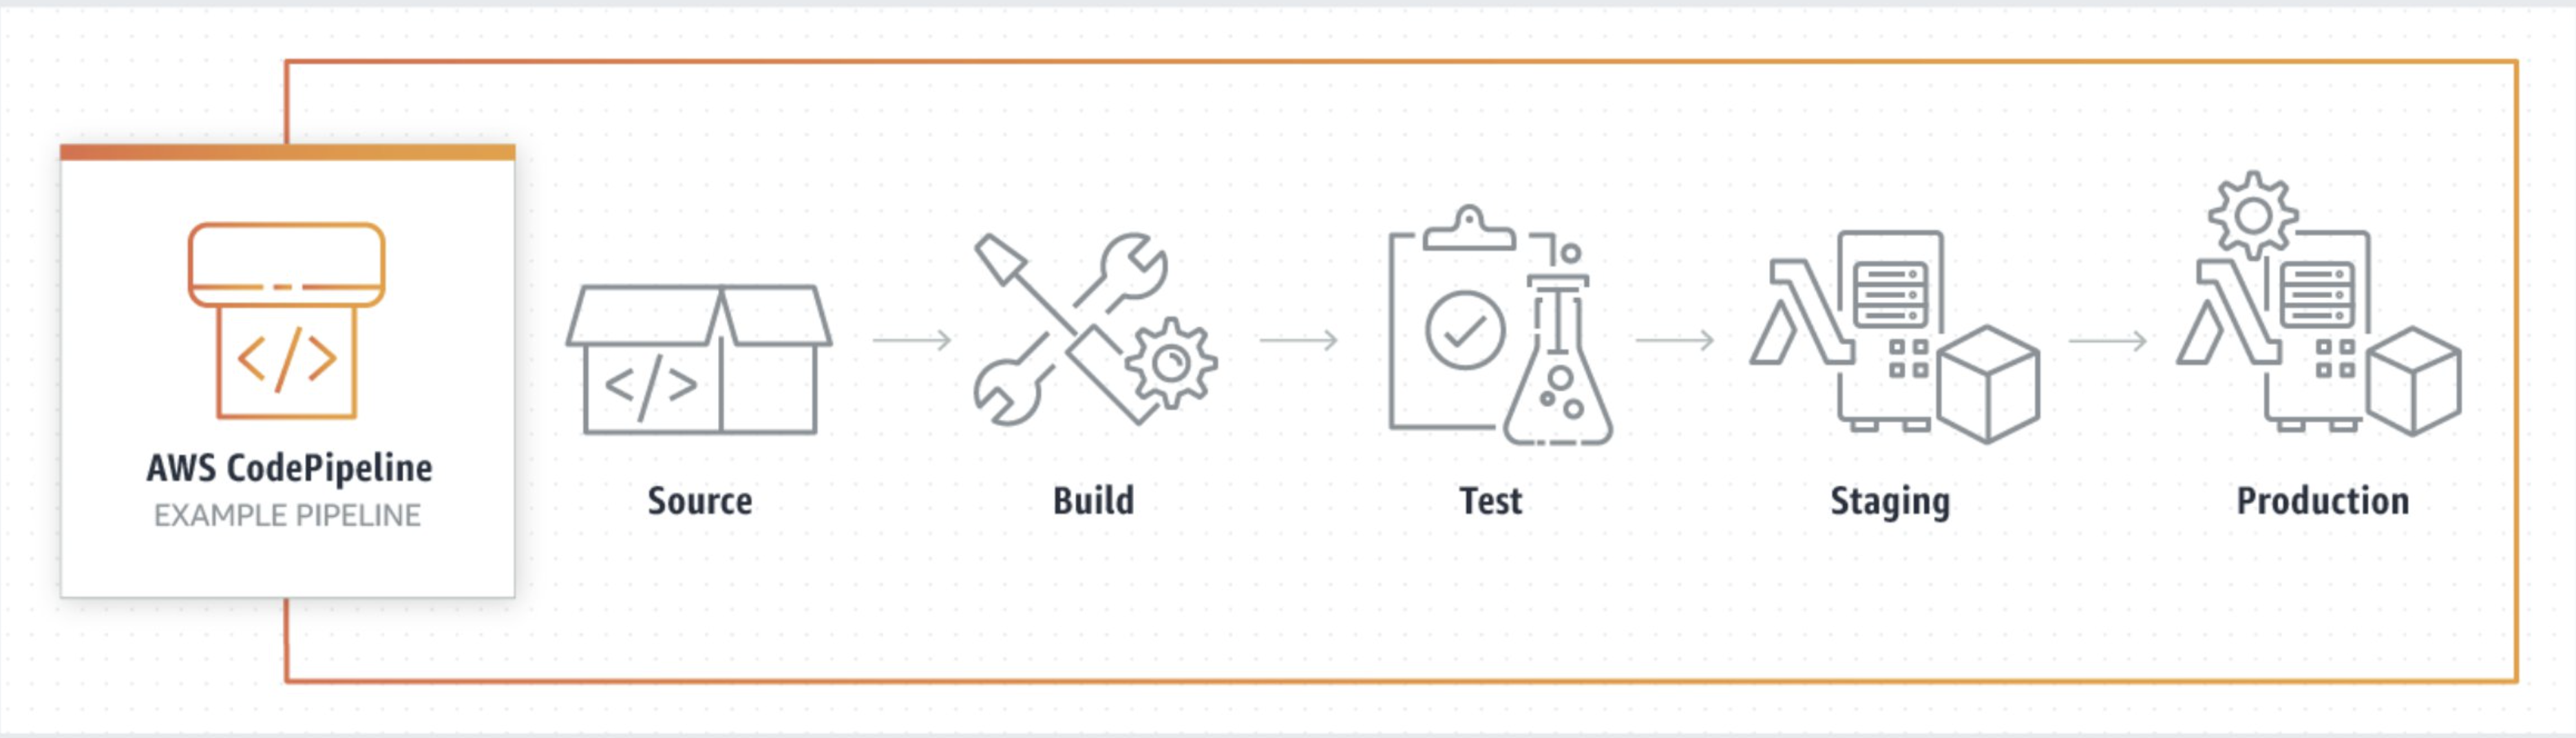
A: There are a few ways, but a strong answer is to mention AWS’s native DevOps tools and outline a pipeline flow. For example:
- Source: Code is stored in a repository like AWS CodeCommit (Git) or you could use GitHub/Bitbucket integrated with AWS. A commit to the main branch triggers the pipeline.
- Build: Use AWS CodeBuild to compile the code, run tests, and produce artifacts (like a Docker image or zip file). CodeBuild can pull dependencies, run unit tests, etc. If the project is containerized, CodeBuild can build a Docker image and push to Amazon ECR (Elastic Container Registry).
- Testing/Approval: (Optional) After build, you might have a step to deploy to a test environment. For instance, using CodeDeploy or AWS CodePipeline’s integration to push to a staging environment (like an ECS cluster or an EC2 instance) for smoke testing. Or run automated integration tests.
- Deploy: Use AWS CodeDeploy for deployment. CodeDeploy can handle rolling updates or blue-green deployments to various targets: EC2 instances, ECS containers, Lambda functions, etc., depending on your app’s architecture. If it’s a simple web app on EC2 or autoscaling groups, CodeDeploy will orchestrate the deployment (install new version, etc.).
- Orchestration: AWS CodePipeline ties these steps together. CodePipeline is the service that defines the sequence: pull from CodeCommit -> build with CodeBuild -> test -> deploy with CodeDeploy. It manages transitions and can include manual approval actions (e.g., a manager must approve before production deployment).
- Monitoring the Pipeline: Mention that you’d use Amazon CloudWatch to monitor pipeline executions (CodePipeline emits metrics and logs). You can set up notifications on failures via Amazon SNS.
This shows you know AWS’s DevOps suite. You could also mention alternatives: e.g., using Jenkins on an EC2 to do CI/CD, or GitHub Actions pushing to AWS. But since the question is likely looking for your knowledge of AWS services, focusing on CodePipeline/CodeBuild/CodeDeploy is wise.
As a real-world insight, note that AWS CodePipeline supports cross-region triggers and complex workflows – in fact, AWS has blogged about using CodePipeline + Terraform for multi-region deployments. So you can hint that AWS pipelines can grow to enterprise scale, deploying infrastructure as well as code.
Example answer snippet: “I’d use a CodePipeline with three stages: Source, Build, Deploy. For source, any push to our CodeCommit repo triggers the pipeline. The Build stage uses CodeBuild with a buildspec.yml that installs dependencies and runs tests (for our Node.js app for example). If tests pass, CodeBuild also dockerizes the app and pushes to ECR. Then the Deploy stage uses CodeDeploy. We have an EC2 Auto Scaling Group behind an ELB, and CodeDeploy in a rolling configuration updates each instance with the new Docker image (pulling from ECR). We configured CodeDeploy to do a health check on the ELB after each instance updates. This way, the deployment is rolling with no downtime – if any instance fails health checks, CodeDeploy stops the deployment.” This demonstrates familiarity with AWS tools and deployment strategies.
Q2: How would you implement Infrastructure as Code for an AWS environment?
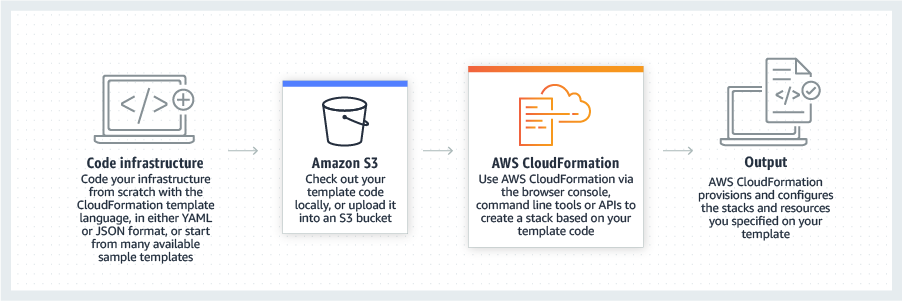
A: AWS offers a native IaC service called AWS CloudFormation. You define templates (in YAML/JSON) describing resources like EC2 instances, VPCs, S3 buckets, etc., and CloudFormation provisions them in order, handling dependencies. Alternatively, many DevOps teams use Terraform (an open-source IaC tool) for AWS, which is cloud-agnostic but very popular for AWS automation.
A good answer can mention both:
- CloudFormation: tightly integrated, supports all AWS resources, allows you to manage stacks (groups of resources). You might use CloudFormation to set up the entire infrastructure for an application (network, security groups, EC2, RDS database, etc.). It’s declarative – you describe the end state and CloudFormation figures out create/update/delete actions. CloudFormation also has a concept of Change Sets so you can review changes before applying.
- Terraform: also declarative and widely used. Companies often prefer Terraform if they operate multi-cloud or find its language (HCL) more flexible. Terraform uses a state file to track created resources. In an AWS DevOps scenario, you might use Terraform scripts stored in Git, and perhaps run Terraform in a pipeline (with something like terraform plan/apply steps). In fact, AWS CodeBuild can be used to run Terraform, and there are AWS blog posts demonstrating Terraform-based pipelines .
- AWS CDK (Cloud Development Kit): If you want to show extra knowledge, mention AWS CDK, which lets you write infrastructure code in higher-level languages (Python, TypeScript, etc.) which then synthesize to CloudFormation templates. This is relatively new but shows you’re aware of modern IaC trends.
Benefits on AWS: consistency across regions and accounts, ability to version and code-review infra changes. You can also tie IaC into CI/CD: for example, pushing a CloudFormation template to an S3 bucket and triggering a deployment, or using CodePipeline with a CloudFormation action to deploy infra changes.
Example: “I’m a fan of Terraform on AWS. In one project, we codified everything: VPCs, subnets, security groups, EC2 instances, and even CodePipeline itself using Terraform. We stored .tf files in Git; our Jenkins pipeline would run terraform plan for review and then terraform apply. This approach meant we could recreate our entire AWS stack from scratch in a new region in about 20 minutes. It also prevented configuration drift. Alternatively, AWS’s own CloudFormation is great – I’ve used it for simpler setups. For instance, we had a CloudFormation template for a basic web app environment (Auto Scaling Group, Load Balancer, RDS database). Developers could launch a full stack for testing by simply deploying the template.”
Q3: How do you handle application monitoring and logging in AWS?
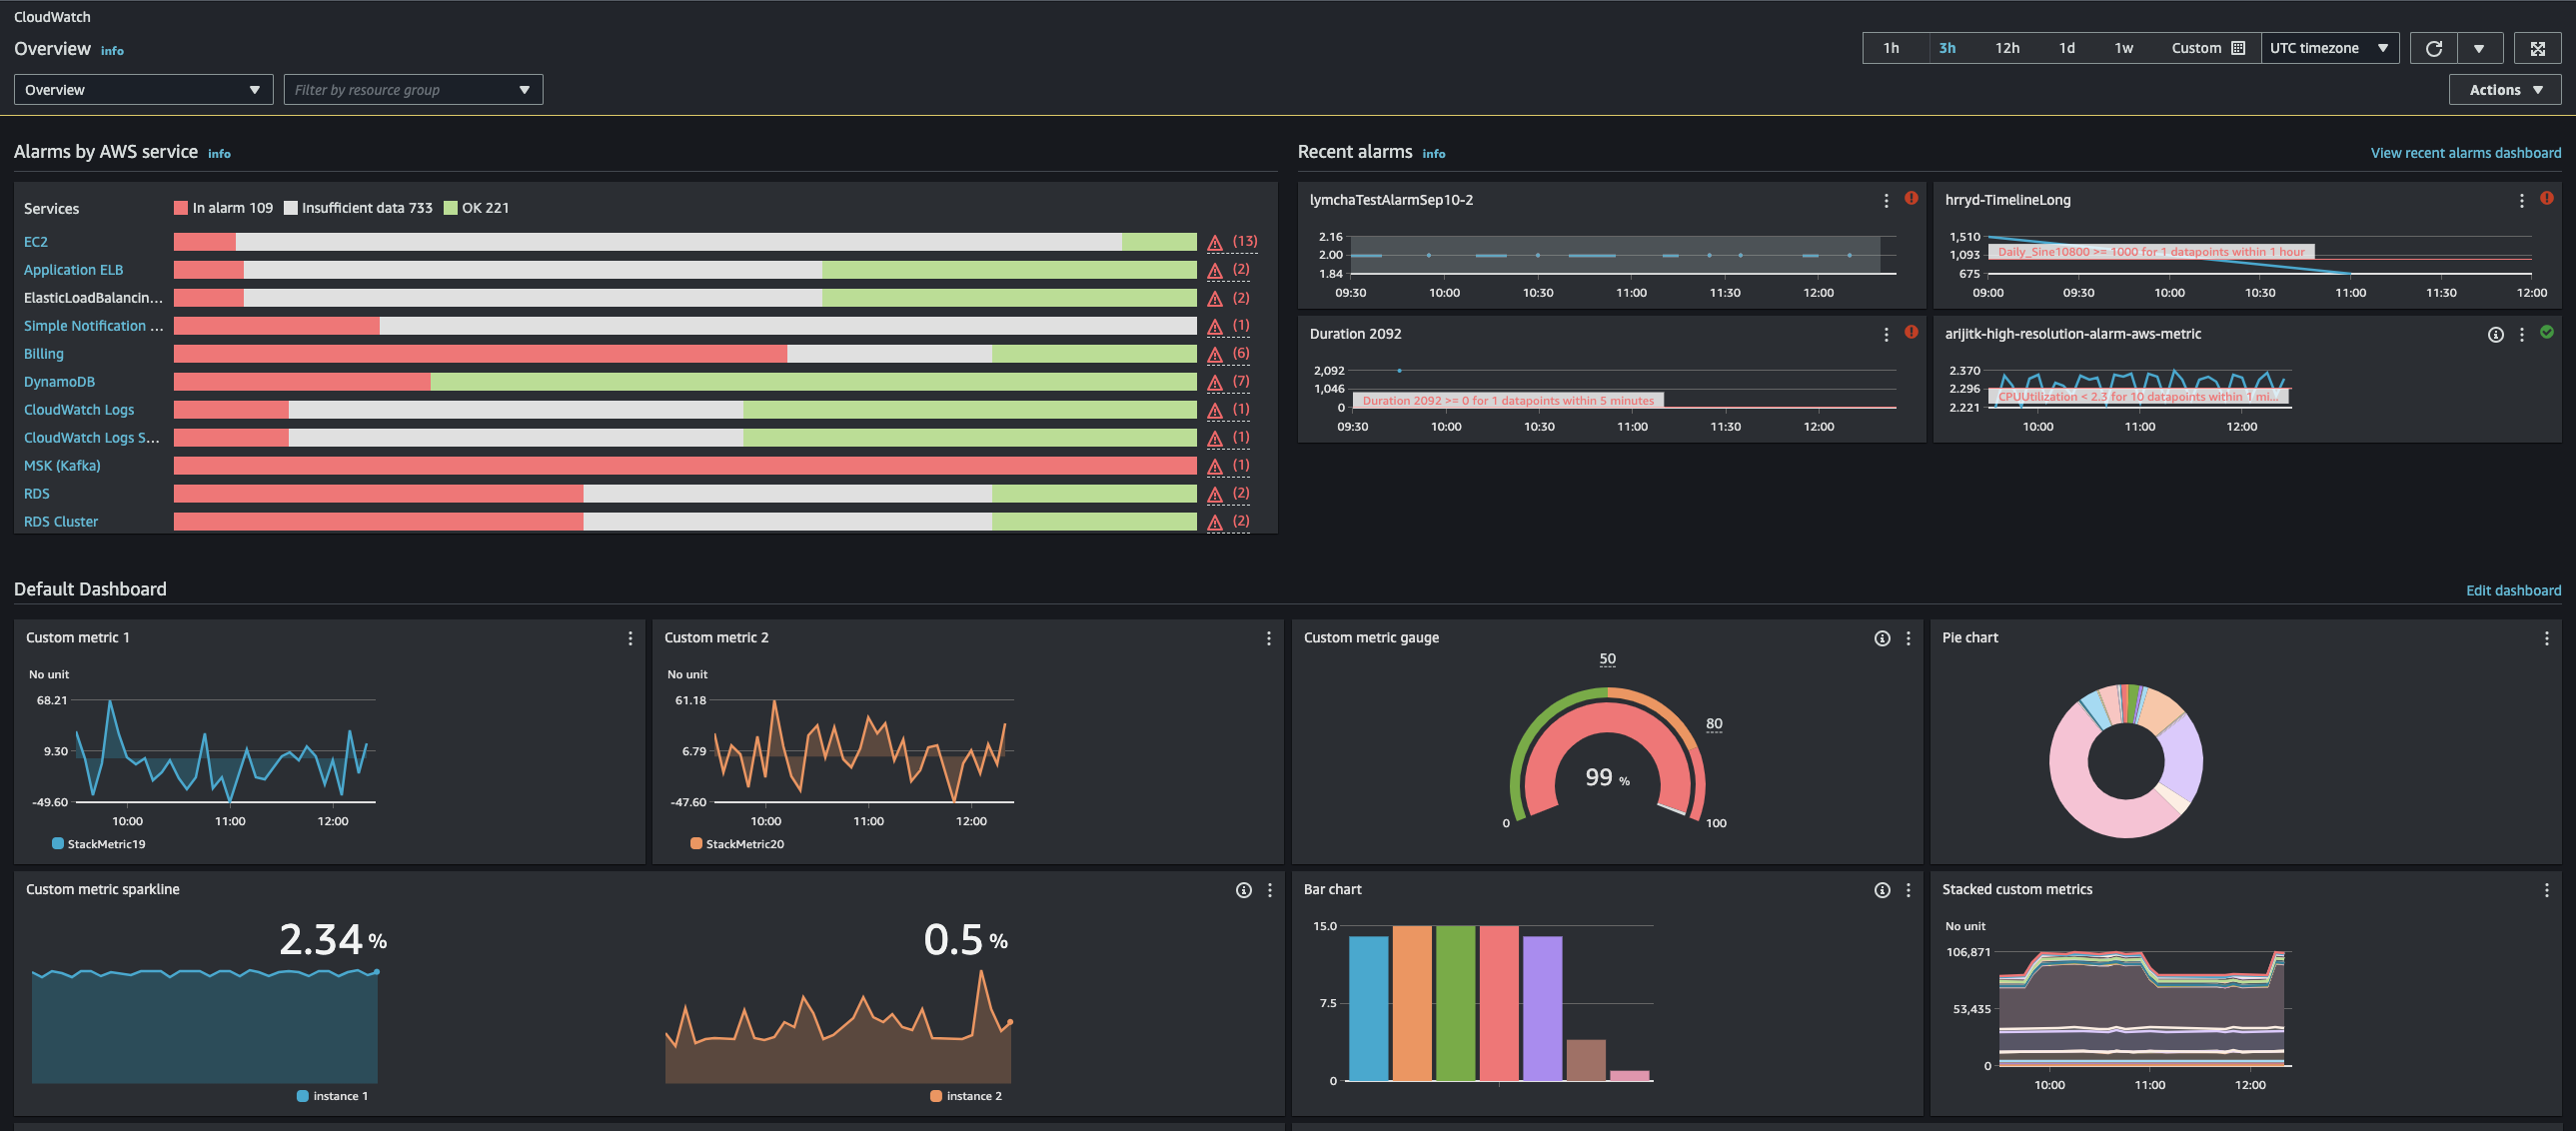
A: Focus on AWS-native solutions:
- Amazon CloudWatch: It’s the go-to for monitoring. CloudWatch collects metrics from most AWS services (EC2 CPU, ELB latency, Lambda invocations, etc.). You can set custom metrics (e.g., application-specific counters) using the CloudWatch API as well. CloudWatch Alarms can be set on any metric to trigger actions/notifications. For example, if CPU > 80% for 5 minutes, send an alert or auto-scale the instances.
- CloudWatch Logs: You can configure your applications or AWS services to send logs to CloudWatch Logs. For example, Lambda functions automatically send logs to CloudWatch. EC2 instances can run the CloudWatch agent to push system/application logs. CloudWatch Logs allows searching and even setting alarms on certain log patterns. It’s not as full-featured in analysis as something like ELK, but it’s managed.
- AWS X-Ray: For distributed tracing (especially if you have a microservice architecture on AWS, perhaps with API Gateway, Lambda, ECS, etc.), X-Ray helps trace requests through your system and find bottlenecks or errors.
- Third-party integrations: It’s fine to mention that sometimes you use tools like Datadog, New Relic, or ELK for more advanced logging/monitoring. AWS has service integrations (e.g., Kinesis Firehose can pipe CloudWatch Logs to Elasticsearch).
- Amazon CloudTrail: This is for auditing AWS API calls – not exactly app monitoring, but mention it if relevant to ops: it logs who did what in AWS (useful for security and audit trails).
So an answer might be: “In AWS, I would use CloudWatch to monitor both infrastructure and application metrics. For example, we tracked EC2 instance metrics and also custom app metrics (like number of processed orders) by publishing them to CloudWatch. We set up CloudWatch Alarms so that if any critical metric went out of bounds (e.g., high error rate or low available memory), it would trigger an SNS notification to our on-call Slack channel. For logging, we used CloudWatch Logs – our app servers were configured to send logs there, which made it easy to search them in one place. In one case, I set up a filter pattern in CloudWatch Logs to look for the word ‘ERROR’ and trigger an alarm if too many errors appeared in a short time. This acted as a secondary alert mechanism for issues that metrics might not catch. Additionally, we utilized AWS X-Ray for tracing in our microservices architecture, which helped pinpoint latency issues between services.”
Q4: How have you implemented containerization and orchestration on AWS?
A: Many modern DevOps environments use containers, so describe AWS container services:
- Docker on EC2: The simplest – run Docker on EC2 instances (maybe with an automation tool). But likely they expect managed solutions:
- Amazon ECS (Elastic Container Service): A container orchestration service. You define Task Definitions (like the container runtime specs) and run them on a cluster of EC2 instances or Fargate (serverless compute for containers). ECS handles placing containers, scaling them, etc. It integrates with CodeDeploy for blue-green deployments of containers and with CloudWatch for monitoring.
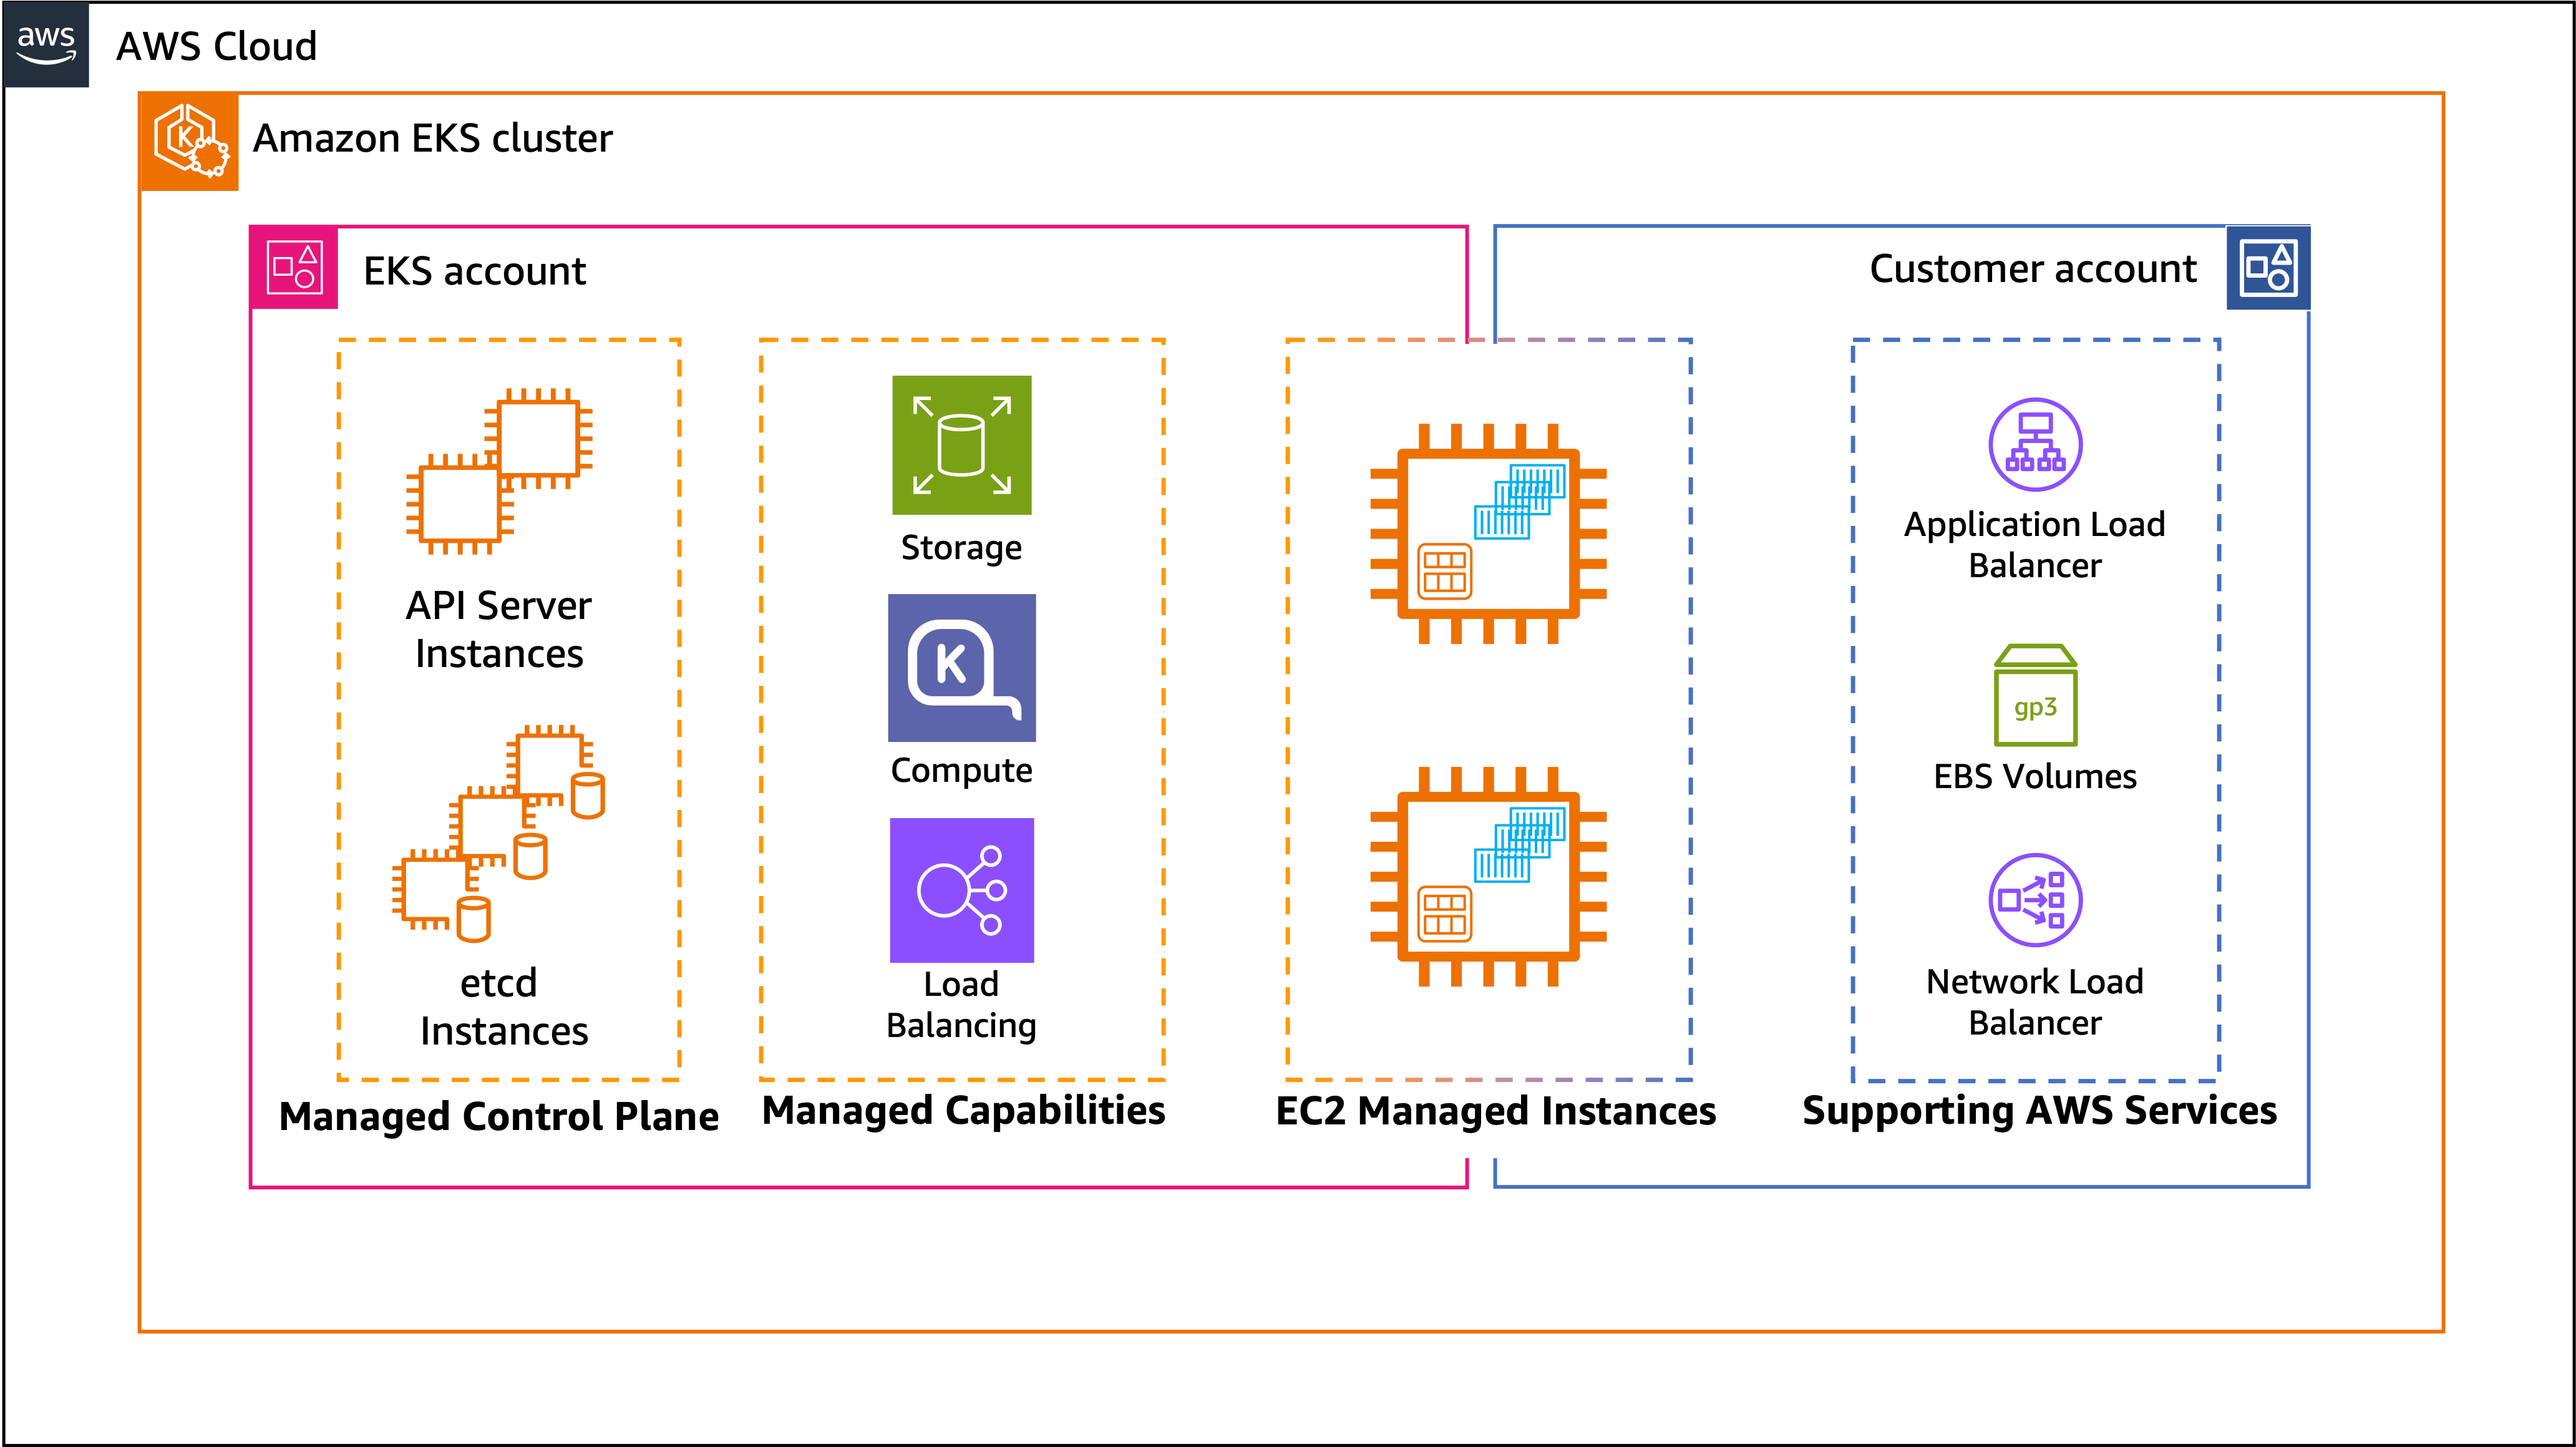
- Amazon EKS (Elastic Kubernetes Service): AWS’s managed Kubernetes. If you have Kubernetes expertise, mention deploying to EKS. With EKS, you manage Kubernetes manifests (deployments, services, etc.) and AWS manages the control plane. You might use kubectl or CI/CD pipelines to deploy to EKS. Many companies use Terraform or CloudFormation to set up EKS clusters and then ArgoCD or Flux for GitOps.
- AWS Fargate: Mention Fargate as an option for serverless containers (works with ECS or EKS). It removes the need to manage EC2 instances for your containers, which is great for simplicity at smaller scales.
CI/CD for containers on AWS: This can tie to earlier answers – e.g., building Docker images in CodeBuild, storing in ECR, deploying via ECS or EKS. CodePipeline can orchestrate these steps.
So an answer: “Yes, I’ve deployed containers on AWS. One project used Amazon ECS because it was straightforward to integrate with other AWS tools. We had our Docker images built in CodeBuild and stored in ECR. Our ECS cluster was running with Fargate, so we didn’t manage servers. We defined services in ECS so that the desired count of tasks (containers) was maintained. Deployment was done via CodeDeploy’s Blue-Green for ECS: essentially, it spun up the new version of the tasks alongside the old, then switched the ALB target to the new tasks. This gave us zero-downtime deploys for our containerized app. In another scenario, I worked with Amazon EKS for a team that preferred Kubernetes. We treated it like any K8s environment – used Helm charts to deploy, and leveraged Cluster Autoscaler (or Karpenter) on AWS to scale worker nodes. AWS made it easier by managing the control plane and integrations like IAM authentication for the cluster. We still used ECR for images and CloudWatch Container Insights to monitor.”
By mentioning ECS or EKS and how you deploy to them, you show you can handle container orchestration on AWS, which is a valuable skill.
Q5: How do you manage secrets and configuration for applications on AWS?
A: This targets knowledge of AWS config and secret management:
- AWS Systems Manager Parameter Store: A service to store configuration values (plain text or encrypted). Apps or Lambda functions can retrieve these at runtime. Often used for less sensitive config (or small scale).
- AWS Secrets Manager: A dedicated service for secret storage (DB passwords, API keys). It stores secrets encrypted and can rotate them automatically. You access them via API or SDK. In a DevOps pipeline, you might have a build step retrieve a secret (with proper IAM permissions) or more commonly, your app at startup pulls needed secrets from Secrets Manager.
- IAM Roles and Policies: Emphasize using IAM roles for services instead of embedding credentials. For example, if an EC2 needs to access an S3 bucket, give the EC2 an IAM Role with that access. Don’t bake long-term credentials into config.
- Config files in S3 (with encryption) or using tools like HashiCorp Vault if multi-cloud. It’s okay to mention Vault for completeness (some companies use Vault heavily).
- Environment-specific configuration: Maybe use separate Parameter Store paths or separate Secrets Manager entries per environment (dev, staging, prod). And use environment variables to point your app to the right config source.
Example: “We never hard-code secrets in our code or pipelines. On AWS, I’ve used Secrets Manager to store things like database credentials. Each microservice had an IAM role that allowed it to read only the specific secrets it needed from Secrets Manager. During deployment, the app containers would load those secrets at startup – for instance, using an environment variable that triggers the AWS SDK to fetch the secret. For less sensitive config (like feature flags or non-secret settings), we used Parameter Store. It was convenient to version parameters and use hierarchical names (like /myapp/prod/ vs /myapp/dev/). Additionally, we used IAM roles extensively – our EC2 instances and Lambda functions had roles that granted only the permissions required (principle of least privilege). This way, even if someone got hold of an artifact or code, they wouldn’t find passwords or keys; and even if one component was compromised, its role limited what it could do.”
Q6: How would you achieve a zero-downtime deployment for an application on AWS?
A: Building on the blue-green discussion in core concepts, but AWS-specific:
- Use Elastic Load Balancer (ELB): If your app is behind an ELB (Application Load Balancer, for instance), you can register new instances (with new version) and deregister old ones gradually, or swap target groups (Blue/Green). AWS’s CodeDeploy for EC2 can automate this (it integrates with ELB to shift traffic as instances pass health checks).
- Auto Scaling Groups (ASG): One approach is to have two ASGs – one for blue, one for green. Deploy new code to the green ASG (by launching new instances with the new version), then update the load balancer to point to green’s instances. This is a blue-green approach using ASG. After verifying, you can scale down the blue ASG.
- AWS CodeDeploy Blue/Green: If using ECS or Lambda, CodeDeploy can handle blue-green (spinning up new Task Set in ECS, shifting traffic, etc.). On EC2, CodeDeploy can also do blue-green by duplicating the environment.
- Rolling deployments: If true blue-green is not needed, a rolling deployment (gradually update instances) can also achieve near zero downtime if done carefully. Auto Scaling can help – e.g., increase desired count, deploy new ones, then terminate old ones.
- Deployment Slots in certain services: For example, AWS Elastic Beanstalk has blue-green support (you can deploy a new environment and swap CNAMEs). AWS Lambda also has a built-in way to do weighted aliases for canary deployments of functions.
Essentially, leverage AWS services that support traffic shifting. So answer: “For zero-downtime in AWS, I would use a Blue-Green deployment strategy. In practice, one way is using an Application Load Balancer. Say my app runs on EC2 behind an ALB. I’d launch a second set of EC2 instances with the new version (maybe in a new Auto Scaling Group). Once those new instances (Green) are up and healthy, I update the ALB’s target group to point to the new instances and deregister the old ones (Blue). This switch is nearly instant, so users don’t experience downtime (the ALB ensures open connections finish). If there’s an issue, I can switch back quickly. AWS CodeDeploy can automate a lot of this. In a previous project, we set up CodeDeploy Blue/Green for our ECS services: CodeDeploy created a new Task Set with the updated Docker image and shifted 10% of traffic to it, then 50%, then 100% – a canary progression – all controlled by predefined hooks and health checks. It gave us confidence in zero-downtime and easy rollback since the old Task Set was still there until the deployment was marked success.”
Azure DevOps Q&A
If your target role involves Microsoft Azure, you’ll likely get Azure DevOps interview questions that assess your knowledge of Azure services and the Azure DevOps tooling. “Azure DevOps” can refer both to the general practice on Azure and the specific Azure DevOps services (formerly VSTS) provided by Microsoft. Below are some real-world Q&A scenarios for Azure.
Q1: How do you implement a CI/CD pipeline on Azure?
A: There are two popular approaches on Azure:
- Using Azure DevOps Services (Azure Pipelines): Azure DevOps is Microsoft’s integrated platform that includes Repos (Git), Pipelines (CI/CD), Boards, Artifacts, etc. An answer here could outline using Azure Pipelines:
- Push code to Azure Repos (or GitHub, which Azure Pipelines can also integrate with).
- Build pipeline: Use Azure Pipelines (YAML or classic) to build the application and run tests. Mention that Azure Pipelines has a hosted pool of build agents, and supports just about any language or platform. After building, produce an artifact or Docker image.
- Release pipeline: Azure Pipelines can then deploy. For example, if deploying to an Azure Web App or Azure Function, there are tasks to do that (or use ARM templates to deploy infra, then deploy app). If using containers, maybe push to Azure Container Registry and then deploy to Azure Kubernetes Service (AKS).
- Note that Azure Pipelines supports multi-stage YAML pipelines now, so CI and CD can be in one pipeline as code.
- Azure DevOps also supports approvals, gates, etc., for control.
- Using GitHub Actions: Microsoft now often pushes GitHub Actions for CI/CD (especially if code is on GitHub). It’s good to mention that if appropriate. GitHub Actions can build and deploy to Azure resources using official Azure action plugins (e.g., Azure Web Apps deploy, Azure CLI actions, etc.).
- Other Azure services: Azure has some platform-specific deployment options too, like Azure App Service can do deployment slots and has a deployment center that integrates with GitHub/Azure DevOps. But the above two cover most cases.
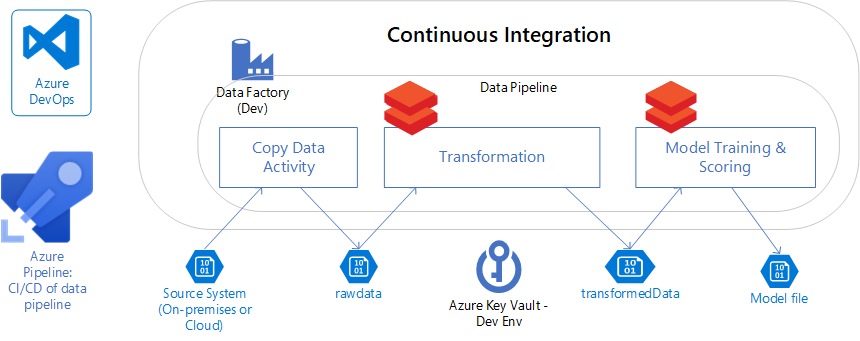
So an answer might be: “On Azure, I’ve used Azure DevOps Pipelines to set up CI/CD. For instance, we had a .NET Core web app – our Azure Pipelines YAML was triggered on any push to main. It would restore NuGet packages, build the solution, run tests, and package the app. The pipeline then had a deploy stage that used an Azure Resource Manager (ARM) template to ensure the Azure infrastructure (an App Service and SQL Database) was in place, and then a task to deploy the new package to the Azure App Service. We utilized Azure DevOps’s built-in tasks for this, which made it straightforward. Also, we leveraged Azure DevOps Artifacts to store build artifacts and Azure Key Vault integration to fetch secrets during the pipeline (like connection strings). Alternatively, I’ve set up CI/CD with GitHub Actions for an Azure project – GitHub Actions would build our Node.js app and use the Azure Web App Deploy action to push it to an Azure Web App. Both approaches achieved automated, reliable deployments on Azure.”
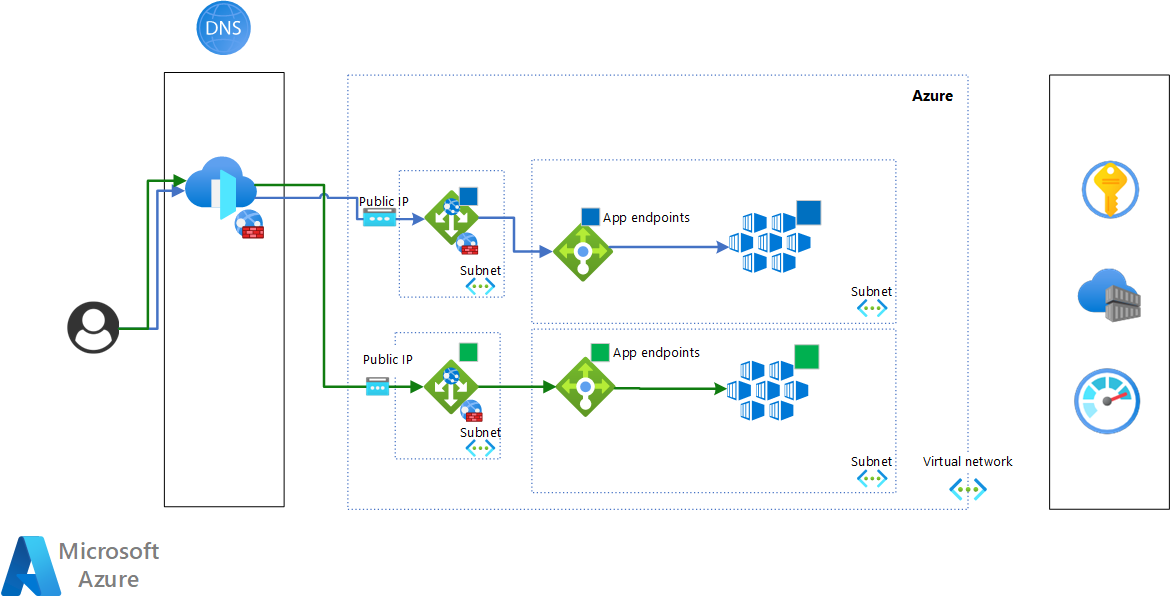
Q2: What is Azure DevOps (the service), and how is it used in a DevOps environment?
.png)
A: This question tests if you understand the Azure DevOps suite (which is a set of services). Azure DevOps Services include:
- Azure Repos: Git repositories (or TFVC, but Git is common) for source control.
- Azure Pipelines: CI/CD pipelines supporting many languages and deployment targets.
- Azure Boards: Agile planning work items (user stories, tasks, bug tracking, sprint boards).
- Azure Test Plans: for managing test cases, manual testing (less likely to mention unless relevant).
- Azure Artifacts: artifact/feed management (NuGet, npm packages, etc.)
Azure DevOps is essentially an end-to-end DevOps toolchain in the cloud. Many companies use it as an alternative to, say, GitHub+Jenkins+Jira (it’s all integrated).
So you’d answer: “Azure DevOps is a cloud platform providing an integrated set of tools for DevOps. It lets teams manage their code (Repos), run continuous integration/continuous deployment pipelines (Pipelines), track work (Boards), and manage artifacts and tests, all in one place. In practice, using Azure DevOps means developers push code to Azure Repos, pipelines automatically build and test that code, and then deploy it to Azure or other environments. The Boards module allows close linkage between code commits and work items or user stories, which improves traceability. For example, I could mention a commit ID in a Boards work item to tie a feature to the actual code changes and deployment that delivered it.”
Then give a real usage example: “In a previous project, we used Azure DevOps heavily: we planned our sprints in Azure Boards, each story was linked to a Git branch in Azure Repos. When we completed a feature and merged to main, an Azure Pipeline kicked off to run our build and tests. If that succeeded, it triggered a release pipeline that deployed the new version to an Azure App Service. We also stored our NuGet packages in Azure Artifacts. It was convenient because everything was in one platform – the devs, QA, and PMs all had visibility. Azure DevOps really helped enforce a good process, for instance, we required each code change to be linked to a Boards work item and go through a Pipeline, ensuring no change reached production without tests and review.”
Q3: How would you manage infrastructure as code on Azure?
A: Azure, like AWS, has multiple IaC options:
- ARM (Azure Resource Manager) Templates: JSON templates native to Azure. They define Azure resource deployments. They can be complex JSON, but are the official way and support basically all Azure resources. You use Azure CLI or Azure PowerShell or Azure DevOps to deploy ARM templates.
- Azure Bicep: This is a new DSL that simplifies ARM templates (makes them more readable, with simpler syntax) and compiles down to ARM JSON. You can mention Bicep as it’s likely to impress that you’re up-to-date with Azure tech.
- Terraform: Many Azure environments also use Terraform. HashiCorp Terraform works with Azure (via Azure providers) and is popular for multi-cloud shops or those who prefer HCL language.
- Pulumi or Azure CLI scripts: Pulumi allows writing IaC in languages like C#/TS (less common to mention unless you used it). Some might just script Azure CLI commands (imperative, not ideal but sometimes done).
So answer: “For IaC on Azure, you can use Azure Resource Manager (ARM) templates or the newer Bicep language. I have experience writing ARM templates to define entire environments – for example, an ARM template to deploy a set of VMs, set up a Virtual Network, storage accounts, and all necessary configurations in one go. We stored the templates in source control and deployed them via Azure Pipelines using the Azure Resource Group Deployment task. Recently, Bicep has made this easier by providing a cleaner syntax (while still producing ARM deployments). I’ve also used Terraform on Azure. Terraform was great for our team since we were also managing AWS resources; we could use one tool for both. In Terraform, we wrote .tf files for Azure resources like Azure App Service, Cosmos DB, etc., and ran terraform apply via our pipeline. Regardless of the tool, the idea was the same: treat Azure resource setup as code so it’s repeatable and versioned. This let our dev team spin up identical dev/test environments by running the same templates, and we could track changes to our infra over time. We also integrated these IaC deployments in CI/CD – e.g., whenever the infrastructure code changed, we ran a pipeline to apply the changes to our staging environment for testing.”
Q4: How do you set up monitoring and alerting for Azure resources and applications?
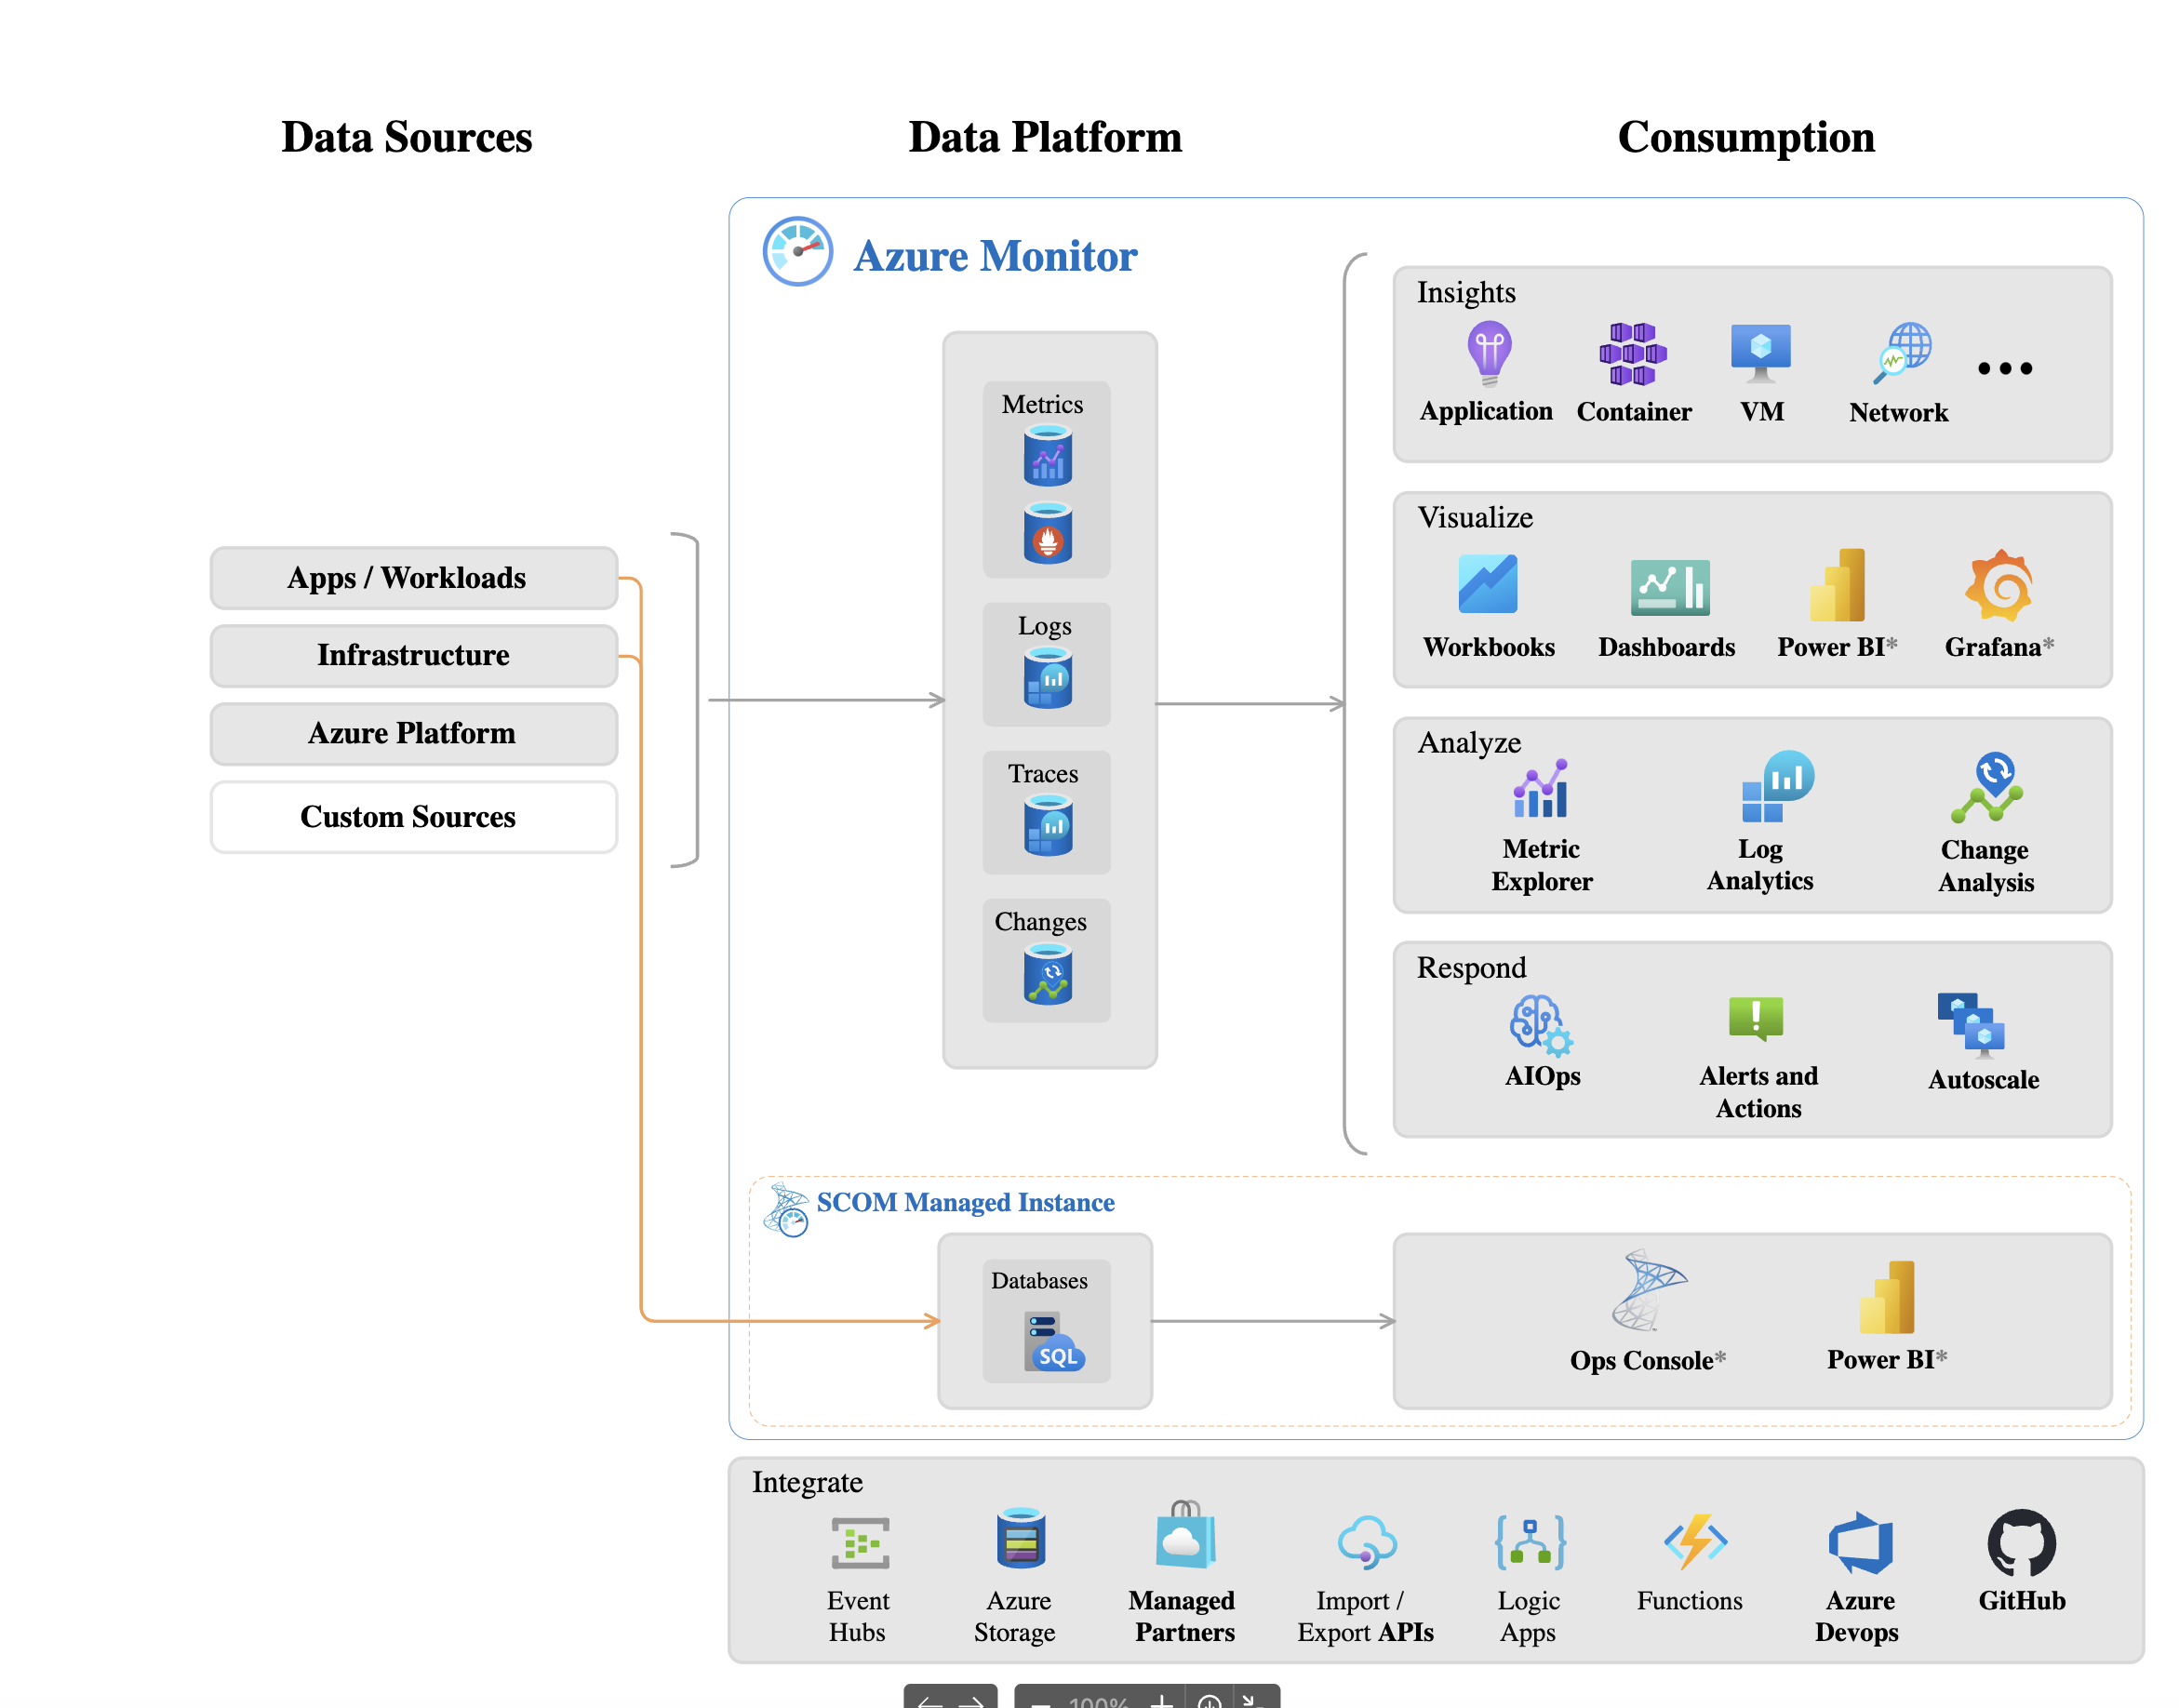
A: Azure’s equivalent to CloudWatch is Azure Monitor. It actually encompasses a few things:
- Azure Monitor Metrics: Platform metrics for Azure resources (CPU for VMs, request count for App Service, etc.). These can be viewed on the Azure portal or queried.
- Log Analytics (Azure Monitor Logs): A centralized log store and query system. Usually you set up a Log Analytics Workspace. Services like Azure App Service, Azure Functions, or AKS can send logs and telemetry to Log Analytics. You can query logs with a powerful Kusto Query Language (KQL).
- Application Insights: A feature of Azure Monitor specifically for application performance monitoring (APM). You instrument your application (via an SDK or auto-instrumentation for certain services) and it collects application logs, exceptions, request traces, etc. It’s great for seeing per-request metrics, dependencies, etc., similar to New Relic or Dynatrace but integrated in Azure. It feeds data into Azure Monitor.
- Alerts: Azure Monitor allows setting alerts on both metrics and log queries. For metrics: e.g., CPU > 80%. For logs: e.g., a certain error event appears X times in Y minutes. Alerts can trigger actions – email, SMS, or call an Azure Function, etc., or create an incident in PagerDuty if integrated.
- Dashboarding: Azure Portal has dashboards, and Azure Monitor Workbooks can create shareable dashboards combining metrics and logs queries for visualization.
So answer: “I would use Azure Monitor for a comprehensive solution. For metrics, Azure Monitor automatically captures things like VM performance or App Service HTTP metrics. I’d create Azure Monitor Alerts on critical metrics, such as CPU usage, memory, or HTTP error rates. These alerts can notify our team via email or webhook into our incident management system. For logs, I’d enable diagnostic logging on key resources – for instance, enable logging on App Services to send logs to a Log Analytics Workspace. With Log Analytics, we can write queries to detect anomalies (for example, if a specific error message appears too often). We actually had a query in Log Analytics that counted 500-level responses from our web app, and an alert if that count exceeded a threshold in 5 minutes. We also used Application Insights for our .NET application – it gave us detailed telemetry like request durations, dependency call failures, and exceptions. Application Insights even provided an automatic distributed trace map of our services. We set up an availability test (ping test) in Application Insights to continually hit our endpoint from different regions, so we’d be alerted if the site was down. All these fed into Azure Monitor, where we had a dashboard to watch the app’s health. This monitoring setup on Azure helped us achieve a quick response time – e.g., when a memory leak started causing high memory usage on a VM, Azure Monitor alerted us and we mitigated it before it crashed.”
Q5: How can you implement a blue-green or canary deployment strategy on Azure?
A: Azure offers a few mechanisms:
- Deployment slots for Azure Web Apps (App Services): This is one of the easiest ways. An Azure Web App can have multiple slots, like “production” and “staging.” You deploy the new version to the staging slot while production keeps running the old version. Once ready, you swap the slots. The swap is very quick and if something is wrong, you can swap back. The staging slot even keeps warmed up after swap if you configure slot settings correctly, resulting in minimal cold start. This is essentially blue-green.
- Azure Traffic Manager or Front Door for canary: If your app is deployed to multiple endpoints (say two instances in different slots or deployments), you could use Azure Traffic Manager (DNS-based routing) or Azure Front Door (edge reverse proxy) to distribute traffic. For example, Traffic Manager can weight traffic between two deployment endpoints – that’s how you do a canary gradually (e.g., 10% to new, 90% to old). Azure Front Door can do session-affinity and more sophisticated HTTP routing; it might also be used for canary by routing a percentage (via header or rule) to a different backend.
- AKS (Kubernetes) approach: If using Azure Kubernetes Service, you’d implement blue-green or canary at the Kubernetes level, which is similar to any Kubernetes environment: either using separate deployments/services and a tool like Argo Rollouts, or using service mesh (Istio, etc.) for traffic splitting.
- Azure DevOps Release Gates: Azure Pipelines has features where you can define gates and progressive exposure, but that’s not a direct traffic split – it’s more an automated approval (like deploy to 10% of instances, evaluate, then continue).
So answer: “For web applications on Azure, one convenient method is using deployment slots. For example, with Azure App Service, I’d have a Production slot and a Staging slot. I deploy the new version to Staging, do my verification (maybe run some tests against it), and then perform a slot swap to make the new version live. Users now hit the new version (previously staging). If there’s a serious issue, I can swap back to immediately restore the old version. We used this approach and it gave us confidence to deploy during the day, knowing we could instantly rollback with a swap. For a canary style deployment, if I needed a gradual rollout, I could deploy the new version to a separate environment and use Azure Traffic Manager with weighted routing. For instance, both the old and new deployments are running, and Traffic Manager directs, say, 20% of traffic to the new one. If metrics in Application Insights look good after some time, we increase to 100%. Azure Front Door could also do a similar weighted distribution at the HTTP layer. In containerized setups on AKS, I’d rely on Kubernetes deployment strategies – for example, label-based splitting or using a tool like Flagger with Istio for canary releases. The Azure ecosystem supports all these approaches, so the choice depends on the specific service and requirements.”
Q6: How do you ensure security in your Azure DevOps pipeline and Azure environments?
A: Similar to DevSecOps earlier, but mention Azure-specific tools:
- Azure DevOps pipeline security: Use Azure Key Vault to store secrets (Azure Pipelines has tasks and variables that integrate with Key Vault). Ensure that service connections (like Azure service principal used by pipelines to deploy) have minimal required permissions (principle of least privilege).
- Infrastructure security on Azure: Use Azure Policy to enforce rules (like all resources must have tags, or no open RDP ports, etc.). Azure Security Center (now Microsoft Defender for Cloud) to get recommendations and secure score.
- Role-Based Access Control (RBAC): Azure uses RBAC for resources – ensure team members and service principals are given appropriate roles (e.g., reader, contributor) at the proper scope, and not overly high privileges at subscription level unless needed.
- Networking best practices: mention using NSGs (Network Security Groups) to limit traffic, using Azure Firewall or App Gateway as needed. Perhaps ensuring use of SSL (Azure has free certs for App Service, etc.).
- DevOps side: If using containers, scan images using Azure Container Registry’s scanning (integrates with Defender). If using IaC, maybe use Terrascan or similar to scan templates.
Answer: “We treat security as integral in Azure. For our Azure DevOps pipelines, we never embed secrets in the pipeline definitions; instead we use Azure Key Vault to store secrets (like API keys, passwords) and Azure Pipelines can fetch those at runtime through a secure connection. The service principal that our pipeline uses to deploy to Azure has a scoped role – for example, it’s Contributor only on the specific Resource Group we deploy to, not the entire subscription. This limits impact if those credentials were ever compromised. In Azure itself, we leverage Azure RBAC to control access – developers might have contributor access to their dev resource group but only reader in prod, etc. We also enable Azure Security Center (Defender for Cloud) which continuously scans for vulnerabilities or misconfigurations (like a storage account with public access) and sends alerts. Another practice: we use Azure Policy definitions to enforce things like all VMs must have disk encryption and all web apps must only be accessible via HTTPS. Our pipelines include security tests as well – for instance, we run CredScan (for secret scanning in code) and OWASP ZAP for dynamic testing on a test environment. By combining these measures, we ensure our Azure deployments follow the best security practices at every stage.”
That covers some key Azure scenarios. You’ve now seen how to discuss DevOps implementation on both major clouds. Finally, let’s address role-specific questions – what you should expect as a DevOps Engineer, Senior DevOps Engineer, or DevOps Manager, since the focus and scope of questions will differ.
DevOps Engineer (Mid-Level) Q&A
For a mid-level DevOps Engineer role, interview questions will focus on hands-on technical skills and experiences. They assume you know the fundamentals (like CI/CD, IaC, etc.) and will probe how you apply them. These devops engineer interview questions often start with “Tell me about a time…” or “How have you done X…”. Here are some likely questions and how to handle them:
Q1: Describe a CI/CD pipeline you implemented. What tools did you use and what were the steps?
A: Here, you should pick a project from your experience and walk through the pipeline. For example:
“In my last role, I built a CI/CD pipeline for a microservice written in Python. We used GitLab CI (or GitHub Actions/Azure Pipelines/Jenkins – whatever your case) for automation. Whenever a developer pushed code or opened a merge request, the pipeline would trigger. The steps were: (1) Build – we installed dependencies and ran a lint check (using flake8) and unit tests with pytest. We also built a Docker image for the service. (2) Test – After unit tests, we spun up a test container and ran integration tests against a local database to ensure everything worked together. (3) Artifact – We pushed the Docker image to our registry (AWS ECR). (4) Deploy – For staging environment, the pipeline automatically deployed the new image to a Kubernetes cluster (using kubectl and a Helm chart). For production, we had a manual approval step, then it deployed similarly to the prod cluster. We also implemented a Slack notification at the end of the pipeline to notify the team of success or failure.”
Mention the tools (CI platform, any build/test frameworks, deployment method) and emphasize how automation and tests were integrated. The interviewer is looking for understanding of pipeline stages and ability to orchestrate them.
If you haven’t built one from scratch, describe one you’ve worked on and what you understand of it. Include things like code review gating, automated tests, static analysis, etc., to show a mature pipeline.
Q2: How have you used Infrastructure as Code in your work?
A: Relate a specific instance. For example:
“I’ve used Terraform extensively to manage infrastructure. In one project, I wrote Terraform modules to set up our entire AWS environment: VPCs, subnets, EC2 instances, RDS databases, and IAM roles. Every developer had their own isolated environment in AWS which they could bring up by running our Terraform scripts. This way, their dev environments mirrored production. We stored the Terraform code in Git, and changes went through code review. I also implemented remote state storage in an S3 bucket with locking via DynamoDB to ensure no two people ran Terraform at the same time interfering with each other. Using IaC was a game-changer – for example, when we needed to upgrade our servers, we just changed an instance type in code and re-applied. It also helped in disaster recovery tests – we could tear down and recreate an environment from scratch in under an hour.”
This shows hands-on comfort with IaC tools, and understanding of best practices (like remote state, code review for infra). Adapt the example to your experience (CloudFormation, ARM/Bicep, Ansible, etc., are also fine to mention).
Q3: How do you approach monitoring and incident response?
A: Show that you’ve been involved in setting up monitoring and also responding to issues:
“I set up monitoring dashboards using Grafana connected to Prometheus (which scraped our Kubernetes cluster metrics). We monitored basics like CPU, memory, and disk, but also application metrics like request latency and error rates (via Prometheus metrics our app exposed). We defined alert rules – for instance, if error rate > 5% for 5 minutes, or if any service is down – which would send alerts to our team’s PagerDuty. When an alert fired, we had a rotation of on-call engineers (I was part of that). Our runbooks were documented in our wiki for common incidents. For example, if a database latency alert happened, the runbook suggested checking a particular dashboard for slow queries, etc. In one incident, we got paged at midnight for high error rates. I jumped in, used our Kibana logs to quickly identify that all errors were coming from one deployment that hadn’t rolled out properly. We rolled it back (using our deployment tool) and the errors stopped. Then the next day, we did a post-mortem to find the root cause (which turned out to be a config file mismatch) and added a check in the deployment pipeline to catch that in the future.”
This demonstrates that you not only set up monitoring/alerting but also acted on it and improved processes.
Q4: How do you manage configurations and secrets across different environments (dev, test, prod)?
A: You can mention using config files, environment variables, and secret management tools:
“We followed the twelve-factor app principle of separating config from code. Our applications loaded configuration (like database URLs, feature flags) from environment-specific config files or environment variables. We used a tool (e.g., dotenv or a custom config service) that would pull the right config for the environment it’s running in. For secrets, we never stored them in the code repo. In development, we might use environment vars or a local secrets file (that’s gitignored). In staging/prod, we integrated with a secrets manager – in AWS that was Secrets Manager, in another project on Azure we used Key Vault. The CI/CD pipeline would fetch required secrets at deploy time and inject them as environment variables into the app container. Also, access to production secrets was restricted – only the service account running the app could retrieve them. This approach meant we could deploy the same artifact to any environment and it would configure itself based on where it’s running. It really simplified our deployments while keeping secrets safe.”
This shows you understand separation of env config and the importance of secret management.
Q5: What is your experience with containers and orchestration?
A: If you have experience with Docker/Kubernetes, describe it:
“I have solid experience with Docker – I containerized our Node.js and Python applications. I wrote Dockerfiles and optimized them (using multi-stage builds to keep the images lean). For orchestration, I worked with Kubernetes (specifically Google Kubernetes Engine in one project). I wrote Kubernetes manifest files for Deployments, Services, ConfigMaps, etc., to deploy our containers. I set up our CI pipeline to apply those K8s manifests whenever we pushed a new image. I’ve also used docker-compose for local development to simulate multi-container setups. In another project, we used AWS ECS to orchestrate containers, which was simpler than full Kubernetes. Through those experiences, I became comfortable with concepts like container networking, volume management, health checks, and scaling containers. For example, I implemented an HPA (Horizontal Pod Autoscaler) in Kubernetes to scale our web service based on CPU usage.”
Even if the question is broad, focusing on how you used containers in a real scenario is better than generic theory. If you haven’t used Kubernetes, mention Docker and maybe how you deployed containers (maybe with ECS, Docker Swarm, or just docker-compose in prod, etc.).
Senior DevOps Engineer Q&A
For a Senior DevOps Engineer, interviews dig deeper into architecture, scalability, and leadership in technical decisions. These senior devops engineer interview questions will likely involve scenarios where you had to design systems or influence teams. They want to see technical breadth, depth, and the ability to drive DevOps improvements proactively.
Q1: How would you design a scalable and secure CI/CD pipeline for a large organization?
A: A senior-level answer should incorporate high-level considerations and perhaps multiple teams:
“Designing a CI/CD pipeline at scale, I’d start by choosing a robust platform that can handle many concurrent builds – for example, GitHub Actions or GitLab CI with a scalable runner infrastructure, or a managed service like Azure DevOps with self-hosted agents. Key aspects:
- Scalability: We’d use autoscaling build agents (if self-hosted, maybe Kubernetes-based agents that scale up on demand). We’d also architect the pipeline configurations to be reusable (templates) so multiple teams can adopt similar patterns without reinventing the wheel. I might introduce a shared library of pipeline tasks or a YAML template in Azure DevOps that all services import.
- Security: Ensure that the pipeline itself is secure – isolate build jobs in clean environments (ephemeral containers/VMs) so one build can’t access another’s data. Use least-privilege for any deployment credentials stored (e.g., use OIDC Federation from GitHub Actions to assume cloud roles, eliminating static cloud creds). Also, enforce code signing and verify artifacts. For instance, if building an API, sign the Docker image and verify that signature on deploy.
- Stages & Gates: For a large org, we often have multiple stages (dev, test, staging, prod). I’d include automated tests and quality gates (like lint, unit tests, security scans) early. Then perhaps a manual approval or automated gate (like “no critical vulnerabilities open”) before deploying to prod. We can integrate change management if needed by the org – e.g., the pipeline could create a change request ticket automatically and require sign-off, but still keep the actual deployment automated once approved.
- Observability of Pipeline: At scale, you need monitoring of the pipeline itself. I’d set up dashboards for build/deploy success rates and timings. Perhaps use a tool like Jenkins’ Build Monitor or custom metrics – DORA metrics too – to track how we’re doing (lead time, deployment frequency, etc.). This can highlight bottlenecks.
- Multi-tenancy & Compliance: If multiple teams share a CI/CD platform, use folder or project-level permissions to restrict access. Possibly set up separate agents for separate departments if needed for isolation. And make sure secrets are handled via a secure store (like HashiCorp Vault or cloud-native secrets managers) integrated into the pipeline.
As a concrete example, in my last company, I helped implement a GitLab CI setup for 50+ microservices across 10 teams. We created a base GitLab CI template that handled building and pushing Docker images and another for deploying via Helm to our Kubernetes clusters. Teams could include those and just supply service-specific info. We set up runners on an autoscaling Kubernetes cluster – at peak, we handled 100+ pipeline runs in parallel after code freeze lifted. We also integrated SAST (SonarQube) and dependency scanning in the pipeline, and made those pass/fail criteria configurable per team (initially just report, later enforce). Over time, this design kept things consistent and secure while accommodating growth.”*
This answer shows consideration of a broad set of concerns: scalability, security, standardization, monitoring, and concrete experiences.
Q2: Tell me about a time you led a significant incident response or outage resolution. What did you do and what did you learn?
A: This tests leadership and technical depth under pressure. As a senior, you’re expected to possibly take charge during incidents. Answer with the STAR method (Situation, Task, Action, Result):
“At my last job, we had a major outage – our API service was down for all customers. As the senior on call, I led the incident response. Situation: a routine deployment triggered database locks that cascaded, freezing the app. Task: My job was to restore service ASAP and coordinate the team. Action: I immediately initiated our incident protocol – alerted additional engineers on chat, and we spun up a Zoom bridge. I took point in assigning roles: one engineer focused on database health, another on investigating the latest deployment differences, while I coordinated and communicated with management every 15 minutes with status updates. We identified that a migration script in the deployment caused a deadlock in the database. I made the call to rollback to the previous app version (using our documented procedure). Meanwhile, I had the DB engineer kill the offending connections and restore the DB to a stable state. Within 30 minutes we restored service. Then we worked on a root cause fix – which was to modify the migration and test it thoroughly in staging before re-attempting. Result: The immediate issue was resolved in 30 minutes, and customers were notified of recovery. In the post-mortem I led the next day, we identified two key improvements: (1) add a step in the CI/CD pipeline to flag long-running DB migrations and require DBA review before prod deploy, (2) implement a canary deployment for database changes (apply to a follower first and monitor). We also realized communication could improve – during the incident, not everyone knew their role initially. So I helped update our incident response plan to designate specific roles (incident commander, comms lead, tech lead, etc.) in major incidents. The experience taught me the importance of having a clear plan and also the value of practicing those scenarios. Since then, I’ve run incident drills with the team so we’re even better prepared.”
This answer shows leadership (assigning roles, communicating), technical skill (knew how to rollback, pinpoint DB issue), and a continuous improvement attitude (took lessons to improve process).
Q3: How do you approach implementing DevOps practices in a team that is new to DevOps?
A: Show that you can be a change agent and educate/lead teams:
- “When introducing DevOps to a team unfamiliar with it, I start by listening and understanding their current pain points – long release cycles, lots of bugs in production, environment setup issues, etc. Then I typically demonstrate quick wins to build buy-in. For example, at a previous company, the QA team was doing entirely manual testing and deployments happened monthly. I helped introduce a basic CI pipeline with automated tests. We started with something small: set up Jenkins to run the existing unit tests on each commit. This alone caught bugs earlier and impressed the team. Next, I introduced the idea of infrastructure as code because developers were often saying ‘it works on my machine’. I organized a workshop to show how Docker could eliminate the “works on my machine” problem. We dockerized one app together, and suddenly developers and testers were running the exact same environment. Over a few months, I gradually advocated for trunk-based development and feature flags so we could release smaller chunks. Key was not to do it all at once, but iterate.
Culturally, I also set up a weekly DevOps sync meeting to break silos – devs, ops, QA all sat together to discuss issues and improvements. This open forum helped reduce mistrust and everyone started to see we share the same goals. I presented metrics – like deployment frequency and lead time – to leadership to show progress (for instance, we went from 1 release a month to 1 a week in 3 months). I find showing data and celebrating successes (like ‘hey, zero downtime in last deployment thanks to XYZ change’) helps reinforce the DevOps mindset.
Importantly, I tried to lead by example: if I expect developers to write infrastructure code or CI configs, I paired with them and coached them through it initially. In time, they became comfortable and even enthusiastic as the benefits became clear. By combining tooling changes with mentorship and aligning improvements to the team’s goals (faster delivery, fewer fires), we successfully adopted DevOps practices.”
This shows leadership, patience, and strategy in cultural change – important for a senior role.
Q4: What are some ways you have optimized cost or performance in a cloud infrastructure?
A: A senior DevOps should think about cost optimization and performance tuning:
- “One example of cost optimization I led: our AWS bill was climbing due to many underutilized EC2 instances. I analyzed CloudWatch metrics and found that our dev/test environments were running 24/7 but only used during work hours. I implemented an automation (using a Lambda function triggered by EventBridge) to shut down dev EC2 instances at 8 PM and start them at 7 AM on weekdays. This simple change cut those environment costs by ~40%. We also right-sized some over-provisioned instances – using AWS Trusted Advisor and custom monitoring, we identified instances running at 5% CPU; we downsized their instance types which saved money without impacting performance. On the performance side, one project had latency issues; I investigated and found our database calls were the bottleneck. We added caching (using Redis via AWS ElastiCache) for frequent read queries, which improved response times dramatically and also reduced load on the DB (indirectly cost-saving by deferring a DB scale-up). Another performance win was enabling HTTP compression and using a CDN (Azure CDN in that case) for static assets of our web app – simple configuration that reduced latency for users globally.
I also look at optimizing CI performance: as a senior, I reduced our pipeline time by 30% by parallelizing independent jobs and using build caching. Faster pipelines meant developers could iterate quicker (performance improvement in engineering throughput, which is also valuable). In summary, I continuously examine metrics and reports from cloud providers to identify waste or slowness, then tune accordingly. Sometimes it’s architecture changes (like using serverless for spiky workloads to save cost, or splitting a monolith into services to scale a hot path), but often small tweaks (auto-scheduling, caching, compression) yield significant improvements.”*
This shows a variety of optimizations, indicating broad experience and a proactive approach to efficiency.
Q5: How do you balance the need for rapid delivery with the need for stability and quality?
A: This is essentially asking about how to avoid “move fast and break things” turning into chaos – a senior should talk about processes and techniques to get both speed and reliability:
- “It’s a classic DevOps challenge: we want to release fast but also not break production. I approach this by implementing safety nets that allow speed with confidence. For example, automated testing at multiple levels (unit, integration, end-to-end) is non-negotiable – this catches many issues before they ever hit production, enabling us to deploy frequently without fear. Next, practices like feature flags are invaluable: they let us merge code and even deploy it turned off, so the code is in production but dormant until it’s ready. This decouples deploy from release – we can deploy anytime (speed) and turn features on gradually or only when stable (quality).
I’m also a fan of canary releases and blue-green deployments (as discussed earlier) which allow us to push changes to a subset of users or separate environment to monitor. This means if there’s a problem, the blast radius is small and we can rollback quickly. It effectively mitigates risk, so we feel safer deploying more often.
Having good observability is another factor – if you can detect issues fast (good monitoring & alerting), you can fix fast. That reduces the perceived risk of moving quickly. In one team, we established SLOs (service level objectives) for uptime and error rates, and tied those to our deployment process: if error budget is low, we’d pause and harden for a bit. That formalized the balance between speed and stability.
Culturally, I encourage a mindset of ‘you build it, you run it’. When devs are on the hook for their code in production, they naturally balance speed and quality – no one wants a 3 AM page. So our devs wrote better tests and thought through failure cases more, which in turn allowed more frequent releases without incident.
So in summary, by investing in test automation, progressive delivery techniques, monitoring, and a culture of ownership, I find you can achieve rapid delivery and maintain high stability. In fact, research (like the DORA reports) shows organizations that do this well actually improve stability as they increase speed – that’s been my experience too.”*
This demonstrates a strategic understanding and references modern DevOps ideas (feature flags, error budgets, DORA findings), suitable for a senior perspective.
“We chose Kubernetes for flexibility, but I was mindful it adds complexity – we mitigated that by using a managed service (EKS) and templating the setup, but it’s something we continuously evaluate.”
DevOps Manager Q&A
A DevOps Manager (or Head of DevOps) will face more strategic and people-oriented questions. These devops manager interview questions assess how you drive DevOps at an organizational level, measure success, and manage teams and processes. Expect questions about metrics, culture, and high-level initiatives.
Q1: How do you measure the effectiveness of DevOps in your organization?
A: A manager should talk about key metrics (likely the DORA metrics) and also business outcomes:
- “I like to use a mix of DevOps metrics and business/operational metrics to gauge effectiveness. On the DevOps side, I track deployment frequency, lead time for changes, change failure rate, and MTTR – the DORA metrics. They give a quantifiable sense of how quickly and reliably the team delivers software. For instance, when I started at my current company, deployment frequency was monthly; over a year we improved that to on-demand (several deploys a day) for many services, while actually lowering our change failure rate from ~20% to under 5%. That was a huge indicator that our DevOps practices were working – faster delivery and higher stability.
However, numbers alone don’t tell the full story. I also look at team health and business impact. For team health, I might use employee survey results or anecdotal feedback: e.g., are engineers less frustrated by release processes? Is on-call burden reasonable? DORA’s research shows a good DevOps culture reduces burnout , so I pay attention to things like overtime hours or burnout signals as effectiveness measures too. For business impact, I tie DevOps improvements to outcomes like: faster lead time -> quicker feature rollout -> maybe improved customer satisfaction or revenue. If we can deliver new features in days instead of months, how has that affected customer retention? Sometimes I measure how quickly we can respond to customer feedback or market changes as an effectiveness measure.
Concretely, I produce a DevOps report for our execs each quarter with metrics: how many releases, average lead time, outage counts and duration, etc., alongside narrative: e.g., “Because we improved our CI pipeline (cut lead time by 50%), we were able to deliver 5 major customer-requested features this quarter versus 3 last quarter.” I also keep an eye on cost of delivery – e.g., did our cloud costs per deployment go down by optimizing infrastructure usage?
Ultimately, effectiveness is a combination of velocity, quality, and people happiness. So I measure in multiple dimensions: speed (freq/lead time), stability (failure rate/MTTR), and culture (engagement surveys, turnover rates). If all are trending well, our DevOps implementation is effective. If one lags (say, change failure rate spikes), that directs my attention to dig in and improve that area.”*
This shows a balanced scorecard approach and familiarity with DORA and organizational metrics.
Q2: How do you foster a DevOps culture among development, operations, and other teams?
A: As a manager, you have influence to shape culture:
- “Fostering a DevOps culture starts with breaking down silos and encouraging collaboration. I do a few things:
- Cross-functional Teams: I advocate for embedding ops engineers into dev teams or vice versa. In a previous company, we moved to a model where each product team had a “DevOps champion” (often an ops-focused engineer) and developers rotated in handling some ops tasks like on-call. This shared responsibility built empathy on both sides – devs learned the pain of 2 AM incidents and wrote better code, ops folks were involved earlier in design.
- Shared Goals and Metrics: I make sure dev and ops share goals. For example, set a common KPI like “95% deployment success rate” or “MTTR < 1 hour”. In one org, initially devs were only measured on feature delivery and ops on uptime, which conflicted. We changed to joint accountability for reliability and delivery speed. That unified purpose helps culture.
- Training and Knowledge Sharing: I organize workshops and lunch-and-learns where teams teach each other. Devs might learn about infrastructure as code, ops might learn about new frameworks devs are using. We also did gamedays (simulated outages) involving everyone – it was both educational and a team bonding exercise. When people solve problems together under a bit of fun pressure, it builds trust.
- Management Support for Experimentation: I ensure that management (including myself) supports taking reasonable risks and learning from failures (a blameless culture). I encourage teams to experiment with new tools or processes in a sandbox, and if something fails, we focus on lessons learned not punishment. That psychological safety is key to DevOps culture .
- Celebrating DevOps Wins: When a team automates a painful manual process or dramatically improves deployment time, I publicize that win in internal newsletters or team meetings. Recognizing those who champion DevOps practices motivates others. For example, we had an ops engineer write a self-service deployment script for developers – we highlighted how that cut support tickets by 30% and praised the engineer and team. That positive reinforcement got other teams asking “hey, how can we do something similar?”
- Tooling that Encourages Collaboration: We introduced chatOps – using Slack with integrated build/deploy notifications and the ability to trigger deploys or get system status via chat. This brought visibility of deployments and issues to everyone in real-time and allowed quick swarming on problems. It subtly nudged culture towards “we’re all in this together” because everyone saw what was happening.
Overall, I lead by example: as a manager I make sure I’m not keeping dev and ops as separate concerns in conversations. I ask both sides questions and facilitate discussions where everyone’s voice is heard. Over time, these practices create a culture where, instead of “us vs them”, it’s a unified DevOps team working toward common goals.”
This shows concrete actions and understanding that culture change is intentional and multi-faceted.
Q3: When planning a DevOps transformation or new initiative, how do you prioritize what to implement first?
A: This is about strategy and focusing on high ROI changes:
- “In planning a DevOps transformation, I first try to identify the biggest bottlenecks or pain points in the current process. I like the Theory of Constraints approach: find what’s slowing us down or causing most problems and fix that first for maximum impact. For example, if deployment is very painful and infrequent, I might prioritize establishing a basic CI/CD pipeline before anything else, because that will unlock faster feedback for everything else. If quality issues are causing frequent rollbacks, maybe focus on improving automated testing and environment parity.
I also consider organizational readiness and quick wins. Early in a transformation, it’s important to get some wins on the board to build momentum. So I might pick something that can be done in say 4-6 weeks and show clear improvement. In one case, we had a manual config management mess. We introduced Terraform for just one key component (the web servers) as a pilot. It wasn’t the whole infra yet, but it solved a concrete pain (inconsistent configs) for that component and demonstrated the value of IaC, making it easier to then extend IaC to other areas.
At the same time, I line up longer-term foundational changes but often implement gradually. I categorize initiatives into people, process, and tools. For example: People – maybe need to set up cross-training (ongoing); Process – implement trunk-based development and feature flagging (might take some policy changes and training); Tools – migrate to a unified CI platform (could be big). I’d prioritize enabling continuous integration (so maybe invest in CI infrastructure and test automation harnesses) early, because without that, other DevOps practices can’t shine.
I often use data to prioritize. If deployment lead time is 3 weeks, that’s a glaring issue; if infrastructure provisioning takes 2 days but happens rarely, it might be lower priority than say flaky tests that happen every PR. In one strategy, we realized our monitoring was severely lacking (we often found out about issues from users). So even though it’s not the flashiest DevOps piece, I prioritized implementing proper monitoring/alerting early in the roadmap – it improved our ability to safely move faster later.
Finally, I get stakeholder input – developers, ops, business – to see what pain they vocalize most. That not only helps prioritization but also buy-in. If devs constantly complain “setting up a test env takes days”, tackling that (with automation) will get their support.
In summary, I prioritize by focusing on what will remove major blockers in delivery or operation first, while securing quick wins to demonstrate progress. Then iterate – each improvement lays groundwork for the next. DevOps transformation is incremental, so picking the right first domino is key.”*
This demonstrates strategic thinking and practical sequencing.
Q4: How do you handle resistance from team members or other departments when implementing DevOps changes?
A: Cultural resistance is common, so a manager should handle it diplomatically:
- “I approach resistance with empathy and communication. First, I try to understand why someone is resistant. Is it fear of job change (ops thinking automation will eliminate their role)? Is it unfamiliarity (developers uncomfortable with operations tasks)? Or simply overload (team feels they can’t take on new processes now)? Understanding the root helps address it properly.
Then I educate and align. I spend time explaining the why of the DevOps change in terms that resonate with them. For instance, an ops team might resist developers having more deployment control. I’d talk to them and frame DevOps as a way to reduce their 2 AM calls and firefighting by catching issues earlier and sharing responsibility, not taking away their importance. For developers resisting writing tests or ops scripts, I might show how those practices actually make their day easier (fewer urgent bug fixes, more stable environments).
In one situation, the QA team was very resistant to automated testing because they felt it threatened their jobs. I sat with them to show that automation would free them from repetitive regression tests and allow them to focus on exploratory testing, which is more valuable. I involved them in selecting testing tools and assured them their expertise was critical to guide what to automate.
Involving resistors in the process is key. I invite them to planning sessions or pilot projects so they have a sense of ownership. For example, a senior sysadmin was skeptical of configuration management tooling. I asked for his help to evaluate Ansible vs Chef for our needs. Once he became the in-house expert of Ansible and led the implementation, his resistance turned into leadership.
I also try to find champions and use peer influence. If one team successfully adopts a DevOps practice and speaks positively about it, others listen more. I’ll have teams demo their improvements in show-and-tell meetings. When someone sees their colleague’s deployment went from hours to minutes, it can change minds.
Sometimes you need to address workload – teams might resist because it feels like “extra work.” In that case, I ensure we adjust sprint plans or priorities so they have time to dedicate to DevOps improvements, and I back them up by showing management why that time is an investment.
Lastly, I remain patient and provide support. Change can be hard. I celebrate small milestones and continuously reinforce positive outcomes. If someone tries a new approach and it fails, we treat it as learning, not blame. Over time, as people see improvements and realize their roles are still secure (and perhaps more interesting now), resistance usually fades.
For instance, initially our DBA resisted developers running database migrations. We agreed on a controlled process – devs would create migration scripts, but the DBA oversaw a review step. Over time, as trust grew and migrations became routine with fewer issues, the DBA himself said the process was working and he felt comfortable automating more of it. That kind of gradual easing in, with respect for people’s expertise, helps turn resistance into collaboration.”*
This answer shows emotional intelligence, strategies for change management, and real examples.
Q5: How do you align DevOps initiatives with business objectives and demonstrate value to upper management?
A: A manager must connect tech improvements to business value:
- “I make it a point to tie DevOps work to business goals. First, I always ask – what are the company’s key objectives this quarter or year? Faster time-to-market, better customer experience, cost reduction, etc. Then I frame our DevOps initiatives in those terms. For example, if a business goal is to enter a new market quickly, I show how a robust CI/CD pipeline enables faster iteration on localized features, thus speeding up that market launch. Or if the goal is reliability (say an SLA with enterprise clients), I map that to our work on improving uptime via better monitoring and incident response training.
I also set quantitative targets that matter to the business, not just tech metrics. For instance, we aimed to cut our lead time from code to deploy by 50% – that translated to being able to respond to customer feedback in days instead of weeks, a competitive advantage. I present such metrics to leadership in terms of outcomes: “Lead time is down 50%, which means we can deliver new features to customers twice as fast.” Similarly, I show how automating processes reduced manpower on routine tasks – maybe saving N hours per week, which we redirected to building new features (essentially cost saving or opportunity gain).
Regular communication is key. I report on DevOps progress in management meetings with simple visuals and stories. I might show a graph of deployment frequency rising over the last 6 months alongside a decline in Sev-1 incidents. And I’ll pair that with a customer story: e.g., “Last quarter a major client reported an issue on our portal – because our pipeline is so fast, we had a fix deployed in 4 hours, contractually strengthening our relationship.” That narrative connects the technical to business impact.
I also align initiatives by prioritizing those that have obvious business value. If improving CI speed by 10% won’t be noticed by end-users but setting up a blue-green deployment can avoid 2 hours of downtime during releases (which definitely affects customers), I’ll do the latter first because it directly supports uptime, a key business promise.
At one point, upper management questioned the time we were spending on infrastructure as code. I explained it like: “Yes, we’re investing developer time in automating infra, but this will enable us to roll out to new regions in a week instead of a month – which is critical for our expansion plans. In fact, we tested it by deploying to a new Azure region last week entirely with our IaC scripts – it worked in 3 days. Without IaC, our competitors might outpace us in reaching those markets.” Framing it in competitive and time-to-market terms got their full support.
In essence, I translate DevOps benefits into the language of risk, revenue, cost, and customer satisfaction. By continuously demonstrating how DevOps improvements lead to fewer outages, faster feature delivery, and happier teams (which means more innovation), I keep DevOps aligned with and indispensable to the business objectives.”*
This highlights communication and strategic alignment skills.
With these role-specific insights, we’ve covered a broad range of Q&A – from hands-on technical details to high-level management strategy.
Next, let’s look at some practical exercises that often come up in DevOps hiring, and how a platform like prepare.sh can help you practice for them.
Hands-On Tasks from prepare.sh
One of the best ways to bridge theory and real-world application is to roll up your sleeves and solve actual DevOps challenges—and that’s exactly what prepare.sh offers. This interactive platform delivers a curated library of hands-on exercises—from writing automation scripts and defining infrastructure as code to authoring CI/CD pipelines and orchestrating containers. Each challenge runs in a sandboxed environment and provides immediate feedback, so you can iterate quickly, learn from mistakes, and track your progress over time.
By working through prepare.sh tasks, you sharpen the practical skills interviewers will test: you’ll automate routine ops, debug deployment issues, and compose reliable delivery workflows under simulated pressure. Along the way, you’ll uncover your own knowledge gaps and gain concrete examples to discuss in interviews. Incorporating regular, targeted practice on prepare.sh into your study routine is a proven way to boost confidence and ensure you don’t just talk DevOps—you do DevOps.
Boost Your DevOps Career with Cloudchipr
You’ve mastered DevOps interview questions, built CI/CD pipelines in AWS, and practiced hands-on on prepare.sh—but there’s one skill that interviewers and employers prize above all: delivering real cost savings. By integrating Cloudchipr into your toolkit, you not only sharpen your FinOps expertise for interviews, you drive measurable impact that accelerates your career.
- Quantify Your Wins: Imagine telling an interviewer, “I cut our cloud bill by $180K/month with automated rightsizing and idle-resource shutdown.” Cloudchipr customers achieve those exact savings—and you can too—turning interview theory into quantifiable achievements.
- Master Cost Optimization: Leverage Cloudchipr’s AI-driven insights and no-code workflows to pinpoint cost anomalies, clean up orphaned resources, and optimize reserved-instance commitments—skills that set top-tier DevOps professionals apart in interviews and on the job.
- Extend Your Service Offering: If your organization needs more than just cost optimization, our 50+ certified DevOps engineers can augment your team with everything from pipeline automation to 24/7 incident response and backup/drill orchestration.
By pairing your DevOps foundations with Cloudchipr’s cost-optimization platform and managed services, you’ll not only ace those DevOps interview questions—you’ll also build a standout resume, drive significant business value, and position yourself as a strategic leader in your next role.
Launch a 14-day free trial of Cloudchipr today and start delivering measurable cost savings—give your DevOps portfolio the competitive edge that interviewers and employers can’t ignore.
Conclusion
Preparing for a DevOps interview can seem daunting due to the broad scope of topics – after all, DevOps isn’t a single skill but a combination of culture, practices, and tools. However, by breaking down the preparation as we’ve done here, you can cover a lot of ground methodically. Let’s recap the key takeaways:
- Master the Fundamentals: Make sure you can speak to core concepts like CI/CD, version control workflows, Infrastructure as Code, monitoring, and the importance of DevOps culture. These are your foundation and often come up as common DevOps interview questions.
- Get Cloud-Specific: If the role mentions cloud platforms, review how DevOps is implemented on that cloud. We walked through AWS and Azure scenarios; similarly, if it’s GCP or others, understand their tooling (e.g., Google Cloud Build, Kubernetes, etc.). Using the cloud’s native services in examples shows you can hit the ground running.
- Adapt to the Role Level: Tailor your examples to the role. For an engineer position, focus on technical problem-solving you’ve done. For a manager, be ready to discuss strategy, team leadership, and metrics. The questions we covered for each role give a flavor of that.
- Practice Hands-On: Don’t just read – actually do. Whether it’s setting up a mini CI/CD pipeline on your laptop, writing a Terraform script, or using platforms like prepare.sh to simulate tasks, hands-on practice will reinforce your knowledge and give you confidence. It’s one thing to say “I would do X,” but another to have done it. Plus, you’ll gather concrete stories to share, which is far more convincing.
- Leverage Pro Tips: Little things – like describing how you debug, how you evaluate trade-offs, how you keep improving – can set you apart. They show you think like an experienced DevOps pro. Sprinkle those insights in your answers (as we did with the callouts).
- Show a Continuous Learning Attitude: DevOps is ever-evolving. If you bring up reading the latest DORA report or experimenting with a new CI tool in your personal lab, it signals that you’ll grow with the role. Companies value engineers who stay current and curious.
- Embrace FinOps: Familiarize yourself with cost-optimization platforms like Cloudchipr. Demonstrating that you can drive real savings—on a free 14-day trial—gives you a powerful edge in both interviews and on the job.
As you get ready for your interview, remember to also breathe and be yourself. Communication is a big part of DevOps – how you articulate a problem or solution is as important as the solution itself. So practice explaining complex topics in simple terms, maybe to a friend or in front of a mirror.
DevOps interviews are indeed challenging, but with comprehensive preparation, they’re also an opportunity to showcase the wide range of skills and passion you’ve developed. You’ve got the knowledge – now go ace that interview! Good luck, and happy deploying.