Kubernetes Monitoring: What Really Matters
.png)
Introduction
If you’ve ever managed a Kubernetes cluster, you know how quickly things can change. One minute your pods are humming along, and the next you’re scrambling to figure out why a service is slow or a node is under pressure. In such a dynamic environment, Kubernetes monitoring isn’t a luxury – it’s a necessity. In fact, monitoring in Kubernetes forces us to rethink traditional strategies, since containerized clusters differ from static VMs or physical servers in several ways. Containers are ephemeral and constantly moving across hosts, which means your monitoring tools must automatically keep up. Kubernetes itself adds layers of abstraction (clusters, nodes, pods, containers, services, etc.), so effective observability requires tracking metrics at each layer. Using Kubernetes’ built-in labels and metadata is absolutely crucial for slicing metrics across these layers. To reliably run Kubernetes in production, you’ll need to extend your monitoring strategy to cover these new container orchestration layers and provide the visibility needed to operate and troubleshoot your workloads.
In this article, we’ll explore what to monitor in Kubernetes, discuss essential Kubernetes monitoring tools and alerting techniques, and cover special areas like cost monitoring and security monitoring. Throughout, we’ll highlight Kubernetes monitoring best practices to help you build a robust, scalable monitoring setup that a seasoned SRE would approve of.
Kubernetes Cluster Monitoring
At the highest level, you need to monitor the cluster’s health – particularly the Kubernetes control plane and other core infrastructure components. The control plane (API server, controller manager, scheduler, etcd) is the brain of the cluster, and if it’s unhealthy, your applications will eventually suffer. Basic cluster monitoring includes checking that these components are up and responding. Beyond simple uptime checks, you should scrape internal metrics from control plane components (most expose a Prometheus /metrics endpoint) to track things like API request rates, latencies, and error counts. Some of these metrics – e.g. request latency or error rate – can even drive proactive alerts if they spike abnormally.
Don’t forget the other infrastructure services running in your cluster. Kubernetes depends on components like DNS (e.g. CoreDNS) and networking proxies (kube-proxy) which also expose metrics and health endpoints. Monitoring these ensures that service discovery and network traffic are flowing properly.
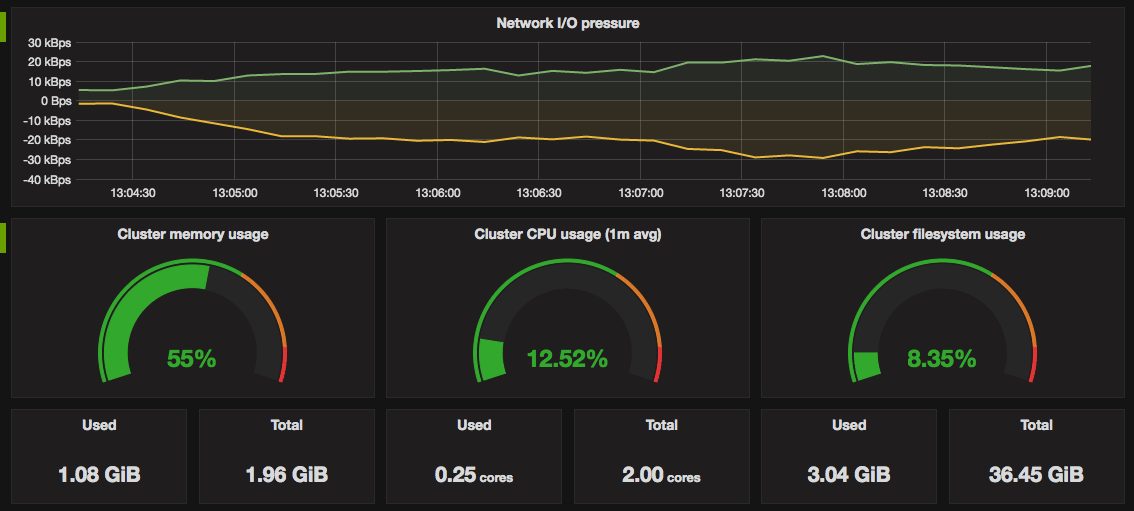
Another vital aspect of cluster-level monitoring is keeping an eye on system resource usage across the cluster. You need visibility into how much CPU, memory, disk, and network each node is using, and how much is free. Kubernetes provides detailed resource metrics at the node and pod level via the Metrics Server, a lightweight aggregator that collects usage from all nodes. This data powers the kubectl top commands and the Horizontal Pod Autoscaler, and it’s available through the Metrics API (/apis/metrics.k8s.io/). Tracking these metrics will tell you, for example, if your cluster is running out of allocatable resources – a sure sign you may need to add nodes or reschedule pods before performance suffers.
Kubernetes Pod and Container Monitoring
While cluster-wide views are important, Kubernetes monitoring really shines when you drill down to the pod and container level. After all, your applications run in pods, and those pods bundle one or more containers that consume resources. Kubernetes makes it possible to examine an application’s performance by inspecting metrics at each level: containers, pods, services, and the overall cluster. By monitoring these levels, you can pinpoint bottlenecks and understand where to optimize performance.
Pod monitoring involves watching the health and resource usage of pods: are they running as expected? Are any restarting (crash looping) or failing liveness/readiness probes? How much CPU and memory is each pod consuming, and is it within its requests/limits? Tools like Metrics Server (and underlying cAdvisor in each kubelet) collect per-container CPU and memory usage so you can see exactly what each pod or container is using. This helps catch issues like a single container gobbling all the CPU on a node or memory leaks that could eventually crash a pod. It’s wise to set up alerts on high pod resource usage or on pods getting OOM-killed so you can react before users notice a slowdown.
Another useful component is kube-state-metrics, which generates metrics from Kubernetes API objects (deployments, daemonsets, etc). This adds visibility into the state of pods and other resources beyond raw usage. For example, kube-state-metrics can count how many pods are in a “CrashLoopBackOff” or how many nodes are marked unschedulable. Including these in your monitoring lets you catch problems like pods stuck in pending, nodes that are NotReady, or deployment rollouts that aren’t progressing. It essentially turns the Kubernetes object states into numerical metrics you can graph and alert on. In short, Kubernetes pod and container monitoring ensures that each workload is healthy and performing within expected parameters, and it surfaces issues in the orchestration layer (like pod failures or node outages) that might otherwise be buried in Kubernetes events.
Kubernetes Application Performance Monitoring
Monitoring the infrastructure is only half the story – you also need to monitor the applications running on Kubernetes. Kubernetes application monitoring focuses on the metrics that reflect your app’s performance and user experience. This often means instrumenting your application code or using an APM (Application Performance Monitoring) tool to gather metrics like request throughput, latency (response times), error rates, and other domain-specific KPIs. For example, a web service might track HTTP request durations or a database might expose query timings. These metrics tell you if your application is performing well from the user’s perspective, not just whether the pod has enough CPU.
Kubernetes makes application monitoring easier by providing a consistent way to expose and collect metrics. Many teams use Prometheus metric export standards for their apps, since Kubernetes is designed to work seamlessly with the Prometheus/OpenMetrics format. You can have your app expose an HTTP /metrics endpoint (using a Prometheus client library) and use Prometheus to scrape it periodically. This yields a rich set of custom application metrics alongside cluster metrics in one system. As the CNCF recommends, using open-source tools like Prometheus (along with the OpenMetrics standard) helps standardize how metrics are collected and displayed across your stack.
Kubernetes performance monitoring is really the combination of all these layers: you watch infrastructure metrics (CPU, memory, network), pod/container metrics (resource usage, restarts), and application-level metrics (latencies, errors, etc) in concert. By correlating them, you get a full picture – for instance, if response latency spikes at the same time a pod’s CPU is maxed out, you’ve likely found the culprit. It’s also wise to monitor platform-specific performance indicators. For example, monitor Kubernetes autoscaler behavior (is the Horizontal Pod Autoscaler adding pods when CPU is high?) and workload scaling events. This ensures your cluster is not only healthy but also efficient in serving your applications.
Kubernetes Security Monitoring
In a cloud-native environment, security is an integral part of monitoring. Kubernetes security monitoring means keeping an eye on anything unusual or unauthorized happening in your cluster. One aspect is monitoring Kubernetes audit logs, which provide a chronological record of actions taken in the cluster. Audit logs can tell you who did what, when, and where – for example, if someone changed a ConfigMap or tried to escalate privileges. By analyzing these logs (often streaming them into a SIEM or logging tool), you can detect suspicious API activity or configuration changes. Kubernetes audit records capture the “who, what, when, where” of each request in the cluster API, which is invaluable for forensic analysis and compliance.
Another key to security monitoring is watching the runtime behavior of pods and containers. Containers might be isolated, but they can still exhibit malicious or unexpected behavior if compromised. A popular open-source tool in this space is Falco, which is a cloud-native runtime security project from CNCF.
Kubernetes security monitoring may also involve checking your cluster against best-practice security benchmarks (e.g. using tools to detect misconfigurations) and monitoring network traffic for anomalies. The bottom line is that beyond performance, you should treat security events as just as important to observe. Set up alerts for things like excessive failed login attempts, newly launched privileged pods, or changes to Roles/ClusterRoles. By integrating security signals into your monitoring dashboard, you ensure that any threat to your Kubernetes environment is noticed early, not after the damage is done.
Kubernetes Cost Monitoring
Running Kubernetes in the cloud can make costs drift silently upward. Autoscaling, burst workloads, and over-generous requests all compound into a bill that traditional cloud invoices can’t explain. Kubernetes cost monitoring is essential because it lets you link every cloud dollar to a specific cluster, node, namespace, or pod—so teams can correct overspend before it snowballs.
Why You Need Granular Visibility
- Pinpoint anomalies: A single runaway job or mis-sized deployment can trigger a sudden spike. Resource-level costs reveal the culprit instantly.
- Right-size confidently: Comparing requested to actual CPU and memory shows which workloads are over-provisioned and safe to scale down.
- Enable shared accountability: Finance and engineering speak the same language when costs map cleanly to teams, environments, and apps.
How It Works
- Collect usage metrics (CPU, memory, storage, network).
- Apply pricing data from your cloud provider to convert raw usage into cost over time.
- Leverage labels to aggregate spend by team, environment, or microservice.
- Alert on budget breaches so you fix issues before the invoice posts.
Tooling Options
- OpenCost (CNCF sandbox): An open-source project that attributes cloud costs to Kubernetes resources and exposes them as Prometheus metrics.
- Managed observability platforms: Products such as Datadog, New Relic, and Cloudchipr combine live usage with pricing APIs, export dashboards, and send proactive alerts. (Later in this blog you’ll see exactly how Cloudchipr streamlines Kubernetes cost insights across multi-cloud clusters.)
Monitoring costs at workload level turns month-end surprises into everyday, data-driven optimisations—freeing budgets and engineering time alike.
Kubernetes Monitoring Tools and Alerting
Thankfully, you don’t have to build a monitoring system from scratch – the ecosystem is rich with monitoring tools that integrate with the platform. The de facto standard in the cloud-native world is Prometheus along with Grafana for visualization. Prometheus is an open-source time-series database and metrics scraper that was built for monitoring modern infrastructure. It has become the de-facto standard within the cloud-native ecosystem for metrics-based monitoring and alerting, thanks to its powerful data model and Kubernetes integration. Prometheus will discover your pods and services (using Kubernetes service discovery) and scrape metrics from them periodically, storing the data for analysis. With a wealth of exporters available, you can get metrics from almost any component – from cluster components to OS-level stats and application metrics – in a matter of minutes. Grafana often sits on top of Prometheus as the dashboard layer, letting you chart and visualize all those metrics. Many premade Grafana dashboards exist for Kubernetes, so you can get a beautiful overview of your cluster’s health at a glance.
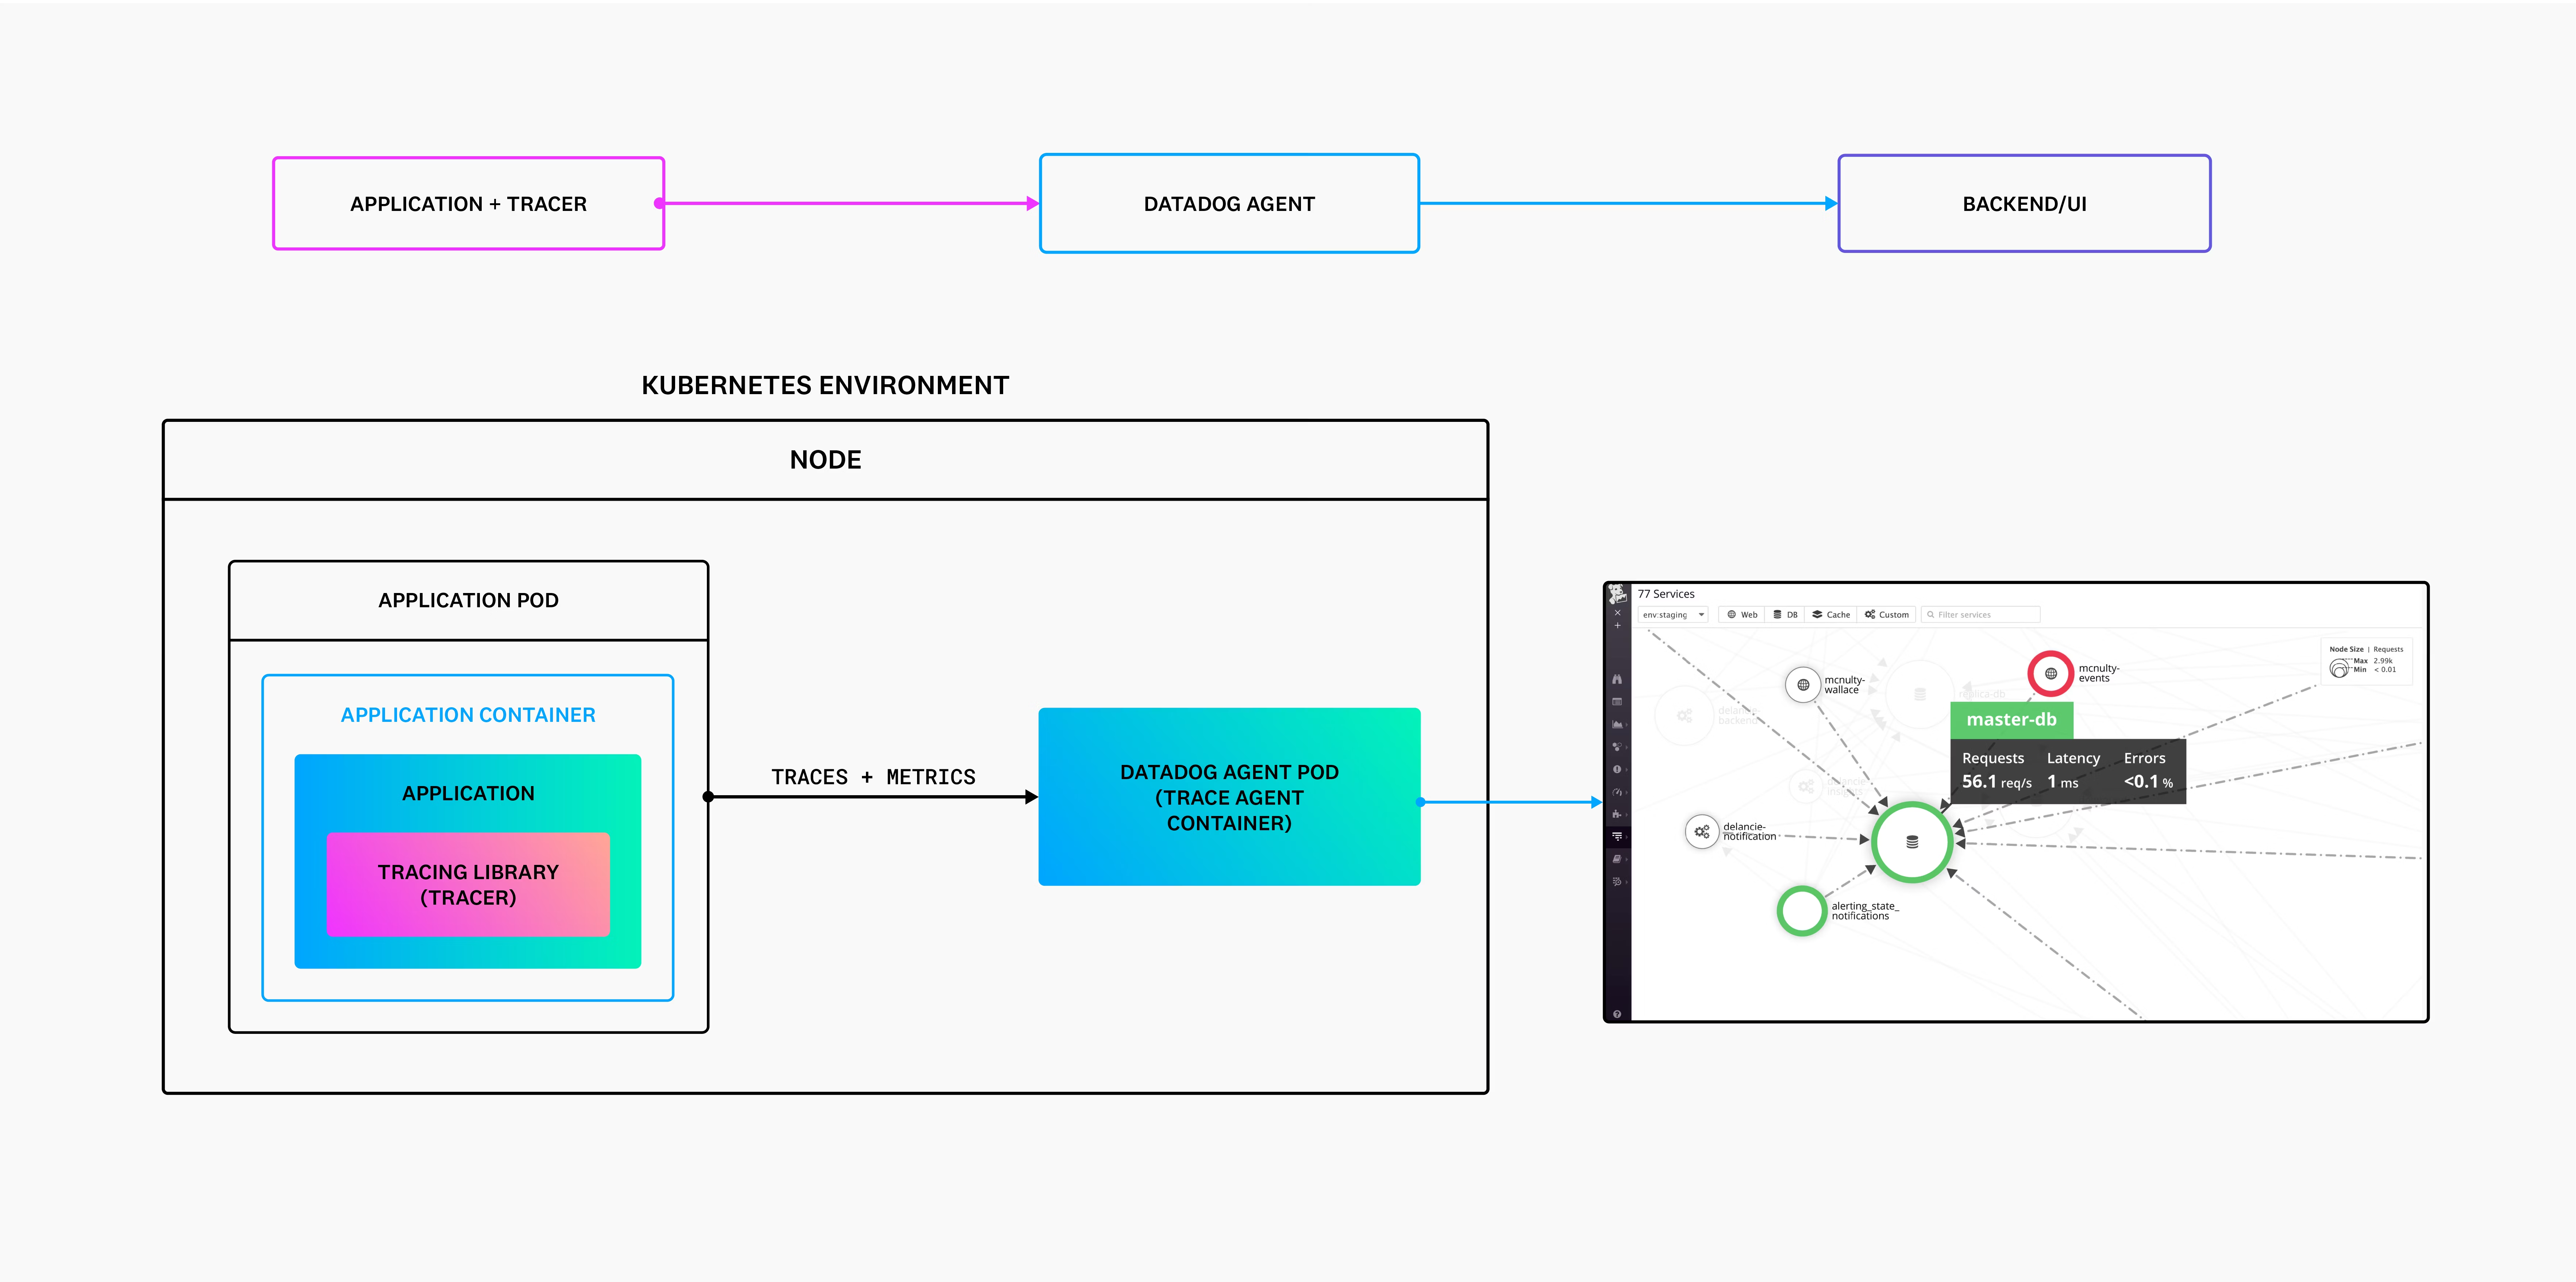
In addition to open-source stacks, there are hosted monitoring solutions. For example, Datadog is a popular SaaS monitoring platform that provides end-to-end infrastructure and application monitoring. It runs an agent in your cluster to collect metrics and events, and it offers Kubernetes-specific features like auto-discovery of new pods and built-in checks for common services. The advantage of such tools is often ease of setup and advanced analytics (and not having to maintain your own servers), though they come at a cost and involve sending data to an external cloud. Major cloud providers also have integrations – e.g., Azure Monitor for AKS or Google Cloud’s Operations suite for GKE – which can collect Kubernetes metrics and logs with minimal configuration.
Kubernetes Monitoring Best Practices
To wrap up, let’s highlight some best practices for monitoring Kubernetes that will serve you well:
- Monitor every layer – Kubernetes introduces multiple layers (cluster, node, namespace, pod, container, application). Make sure your monitoring covers from the infrastructure level (e.g. node CPU, disk, network) all the way to application-level metrics and user experience. This holistic view helps correlate issues (for example, linking a spike in response time to a specific node’s resource pressure). Remember that what you monitored on traditional servers must be enhanced to include container and orchestration layers.
- Leverage labels and namespaces – Use Kubernetes metadata to your advantage. Labels (app, role, environment, etc.) are powerful for grouping metrics and alerts. For instance, you can aggregate CPU usage by team or environment label to find who’s using what. Define a clear labeling strategy so that metrics are tagged usefully. Similarly, monitor at the namespace level for multi-tenant clusters (e.g., track each namespace’s resource consumption to prevent one team from impacting others).
- Enable auto-discovery and dynamic monitoring – In a dynamic Kubernetes environment, manual static monitoring setups won’t scale. Use tools that support service discovery to find new pods and services automatically. This way, when your deployment scales up or you add a new microservice, it gets picked up and monitored without human intervention. Automation ensures your monitoring is always up-to-date in the face of constant changes.
- Set meaningful alerts (and avoid alert fatigue) – Base your alerts on symptoms that indicate real problems (high error rates, saturated resources, etc.) and tie them to SLOs (Service Level Objectives) when possible. Aim for a balance where alerts are neither too sensitive (paging you for a one-second CPU spike) nor too lax. Continuously tune alert thresholds and remove noisy alerts that aren’t actionable. It’s better to have fewer, trustworthy alerts than so many that everyone starts ignoring them. Also, make sure to route alerts to an on-call rotation or team that can act on them immediately.
- Monitor costs and efficiency – Treat cost like a first-class metric. Especially in cloud deployments, keep an eye on resource usage versus actual need. Incorporate cost monitoring tools (like OpenCost or commercial alternatives) to identify unused resources (e.g., idle PVCs, over-provisioned nodes) and to attribute costs to the proper owners (teams or projects). This not only saves money but also encourages efficient use of the cluster.
- Integrate security signals – Don’t silo security monitoring. Feed Kubernetes audit logs into your logging/monitoring system and create alerts for unusual patterns (e.g., an excessive number of failures or unauthorized actions). Deploy a runtime security tool (like Falco) to catch anomalies in real time. Security events often manifest as odd system behavior, so having those alerts alongside your performance alerts gives you a more complete picture of cluster health.
- Continuously improve your monitoring setup – Kubernetes evolves and so do your workloads. Regularly review what you’re monitoring. After every incident or outage, conduct a post-mortem and ask: Could we have detected this sooner? If yes, add a metric or alert for it. Over time, you’ll build a resilient monitoring system that acts as an early warning system for all kinds of issues. Also, stay updated on new tools or features (for example, new metrics in Kubernetes releases, or advancements in observability projects) that could enhance your visibility.
Cloudchipr: One Console for Every Kubernetes Monitoring Challenge
Managing Kubernetes at scale means juggling dozens of data feeds—cluster health, pod utilisation, cost spikes, idle resources, security events and more. Cloudchipr folds all of those threads into a single, FinOps-ready view so teams can diagnose issues, tame costs and automate fixes without hopping between tools.
Multi-Cloud Cluster view
.png)
Cloudchipr automatically discovers every Kubernetes cluster running in AWS, Azure and GCP and lists them side-by-side in a dedicated dashboard. Key efficiency indicators—Idle % and Reserved %—surface at a glance, so a cost-heavy cluster pops out instantly, even in estates with dozens of clusters.
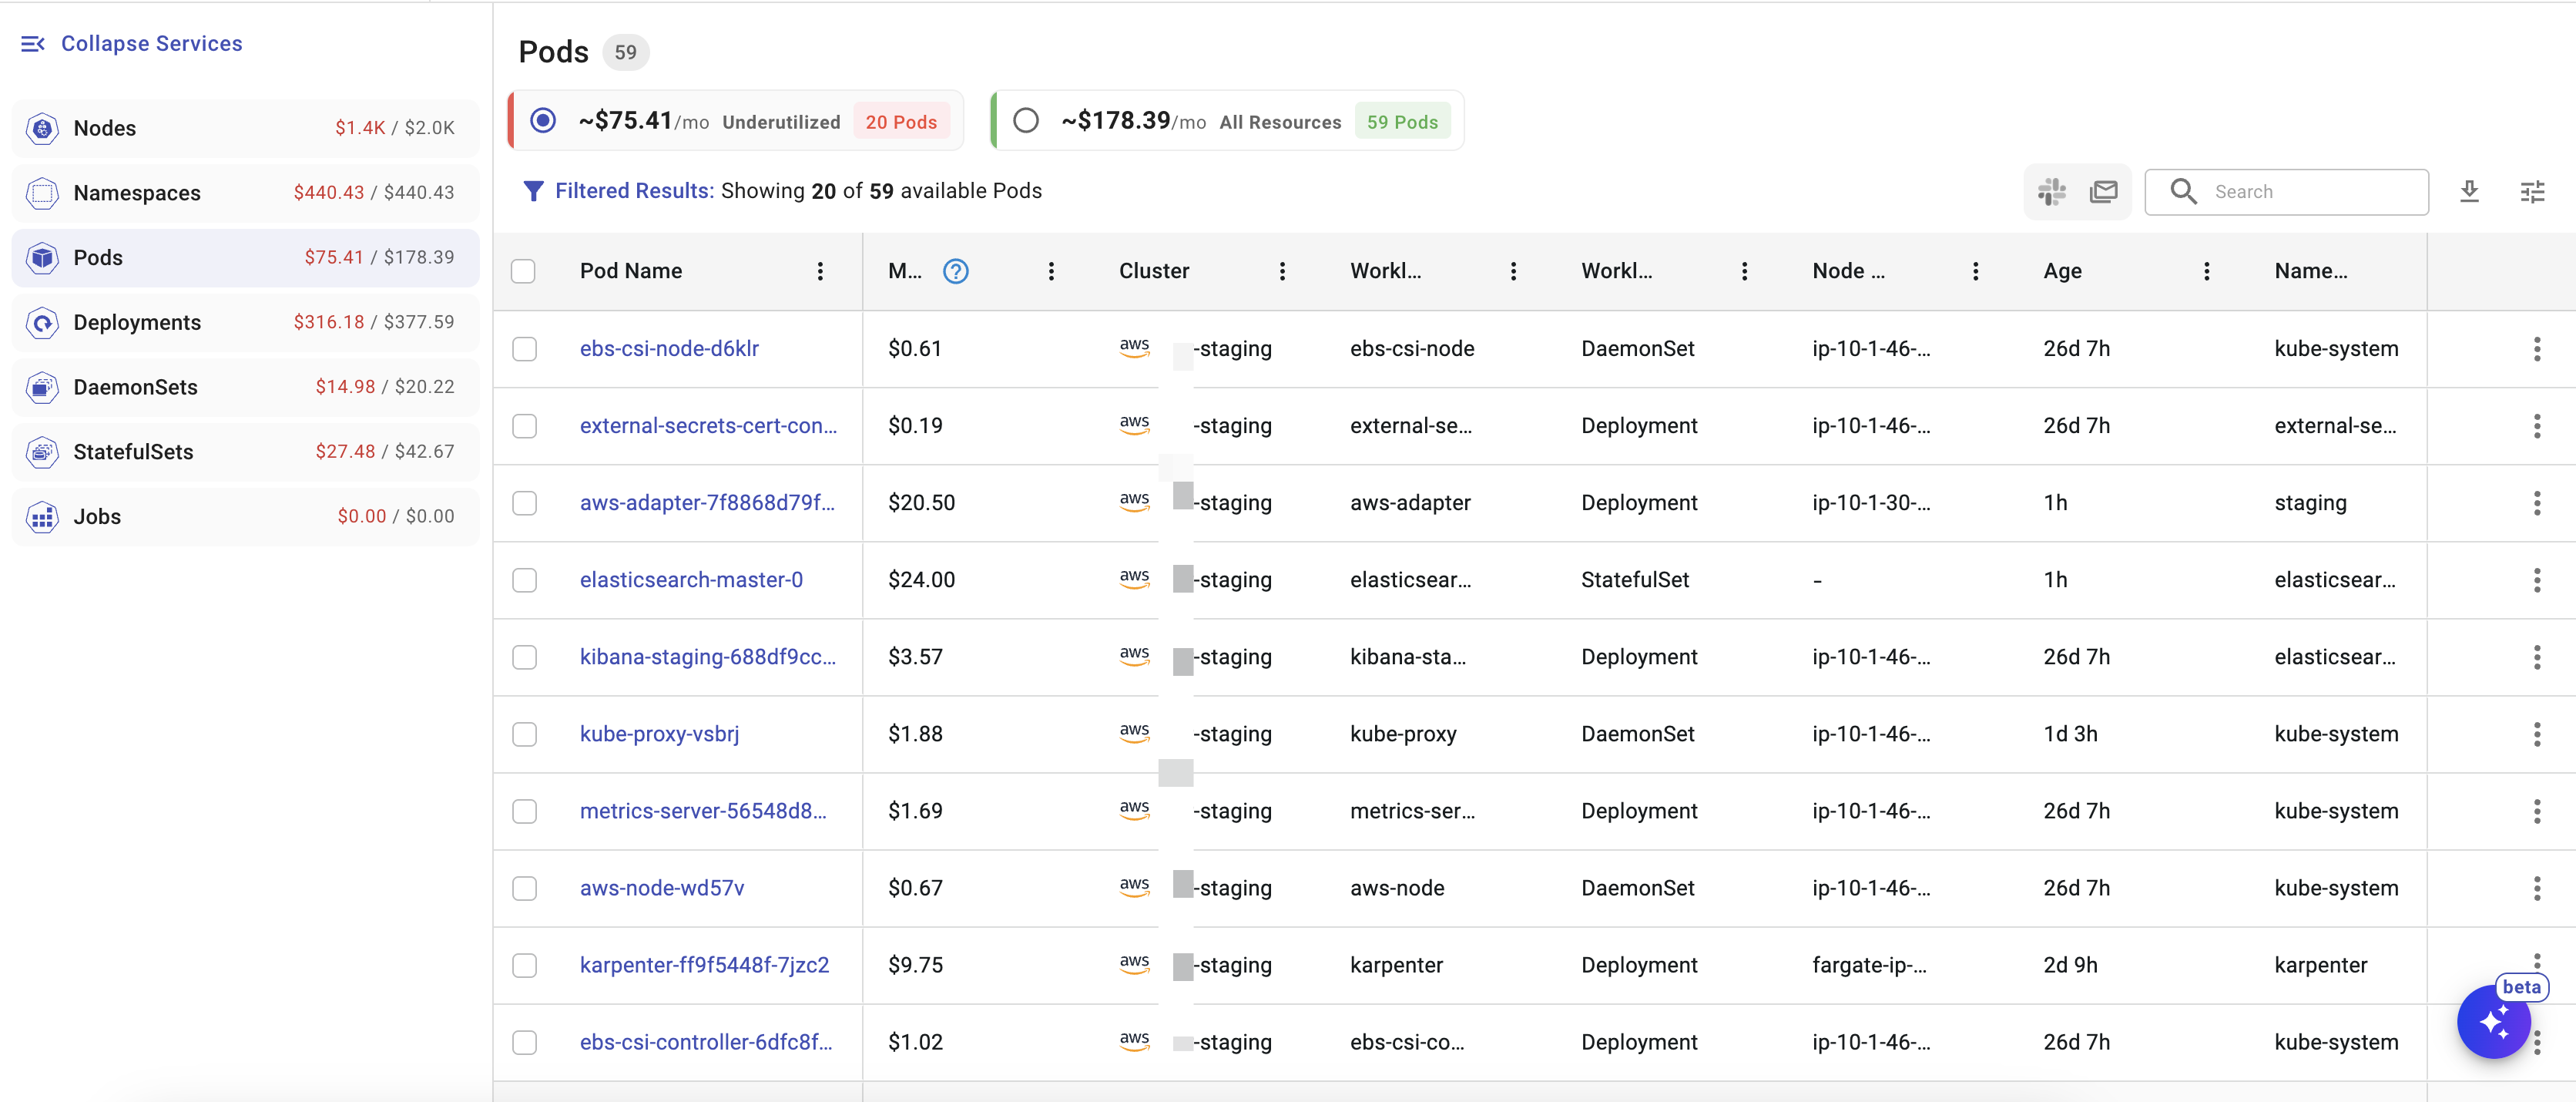
Detailed Resource Insights
.png)
Click a cluster and you drop straight into interactive tables and time-series charts for nodes, namespaces, pods, DaemonSets, StatefulSets and Jobs. Engineers can pivot on CPU, memory or cost trends to spot over-provisioned deployments or noisy neighbours, then jump back out without losing context.
Identification of Underutilized Resources
.png)
Cloudchipr continuously compares live usage with requests, limits, and cost baselines—and lets you configure budgets & alerts that notify you when a pod or node pool is using only a fraction of its allocation, giving you time to right-size or decommission it before waste builds up.
AI-Driven Insights & Automation

Built-in AI agents analyze cluster telemetry, flag anomalies and generate optimisation recommendations—such as moving memory-light jobs to smaller instances or switching low-priority namespaces to Spot capacity. Teams can convert those insights into no-code workflows that scale deployments, tag resources or send Slack messages automatically.
Connecting read-only cloud roles takes minutes; Cloudchipr starts streaming metrics and costs almost immediately. Curious teams can explore all Kubernetes features free for 14 days and see how much waste they can reclaim.
Conclusion
Kubernetes may be a complex, ever-changing platform, but the good news is that monitoring Kubernetes clusters has become easier thanks to a mature ecosystem of tools and best practices. By covering the key areas – from cluster components and pod metrics to application performance, security, and cost – you can operate your Kubernetes environment with confidence. Remember that effective monitoring is an ongoing process: start with the basics, then iteratively refine and expand your coverage. With the right foundation in place, you’ll find that keeping tabs on a Kubernetes cluster is far less daunting than it first appears. In fact, with robust monitoring and alerting, you can sleep a lot easier at night knowing your cluster will tell you when something needs attention – and that is peace of mind every Kubernetes operator deserves.