Product Updates: October 15, 2024
In this release, Cloudchipr introduces Reservations recommendations and visibility, Anomaly Detection Alerts to help users identify unexpected cost spikes, and Private Views in the Resource Explorer and Dashboards. Private Views offer greater flexibility in customizing data views. These updates provide users with enhanced control over their cloud costs while maintaining a seamless and intuitive user experience.
Features:
Commitments: Reservations

Reservations allow you to track your AWS reservations, providing a clear understanding of your reservation coverage and utilization. Like Savings Plans, Reservations helps answer key questions: What percentage of your AWS instances or resources are covered by reserved pricing? By ensuring higher coverage, you can reduce on-demand charges and maximize savings.
Explore the Reservations Feature Through Two Key Subpages:
- Utilization & Coverage: Track your current AWS reservations with detailed insights. Understand what percentage of your resources benefit from reserved instance pricing and identify areas where you might be paying on-demand rates. This helps optimize your AWS savings strategy.
- Recommendations (Coming Soon): Prepare for upcoming features that will provide tailored recommendations on optimizing your reservations, ensuring maximum savings on AWS.
Utilization & Coverage Dashboard:
- Visual Metrics: Analyze your AWS Reservations with dynamic charts with a clear overview of reservation utilization and coverage.
- Detailed Metrics: Track key figures, such as Total Cost, Total Net Savings, and Coverage, are displayed prominently. Customize the date range for these metrics to view historical data and trends, giving you the flexibility to make data-driven decisions.
Reservations and Coverage:
- Reservations Table: Provides comprehensive information about each AWS reservation, including Reservation ID, resource type, linked account, region, payment option, utilization rates, net savings, offering class and start/end dates. This table is key to tracking the effectiveness of your reserved instances and planning future strategies.
- Coverage Table: Utilize the "Group by" filter to organize data by Resource Type or Accounts. This filter enhances your ability to analyze how much of your AWS infrastructure is covered by reservations and where you're incurring on-demand costs.
- Resource Type: Displays details such as the family, region, the portion of spend covered by reservations, on-demand spending, and the percentage of resources covered by reservations.
- Accounts: Organizes reservation utilization by AWS accounts, including color-coded Coverage Bars to visually represent the percentage of resources benefiting from reserved instance pricing.
Detailed Views
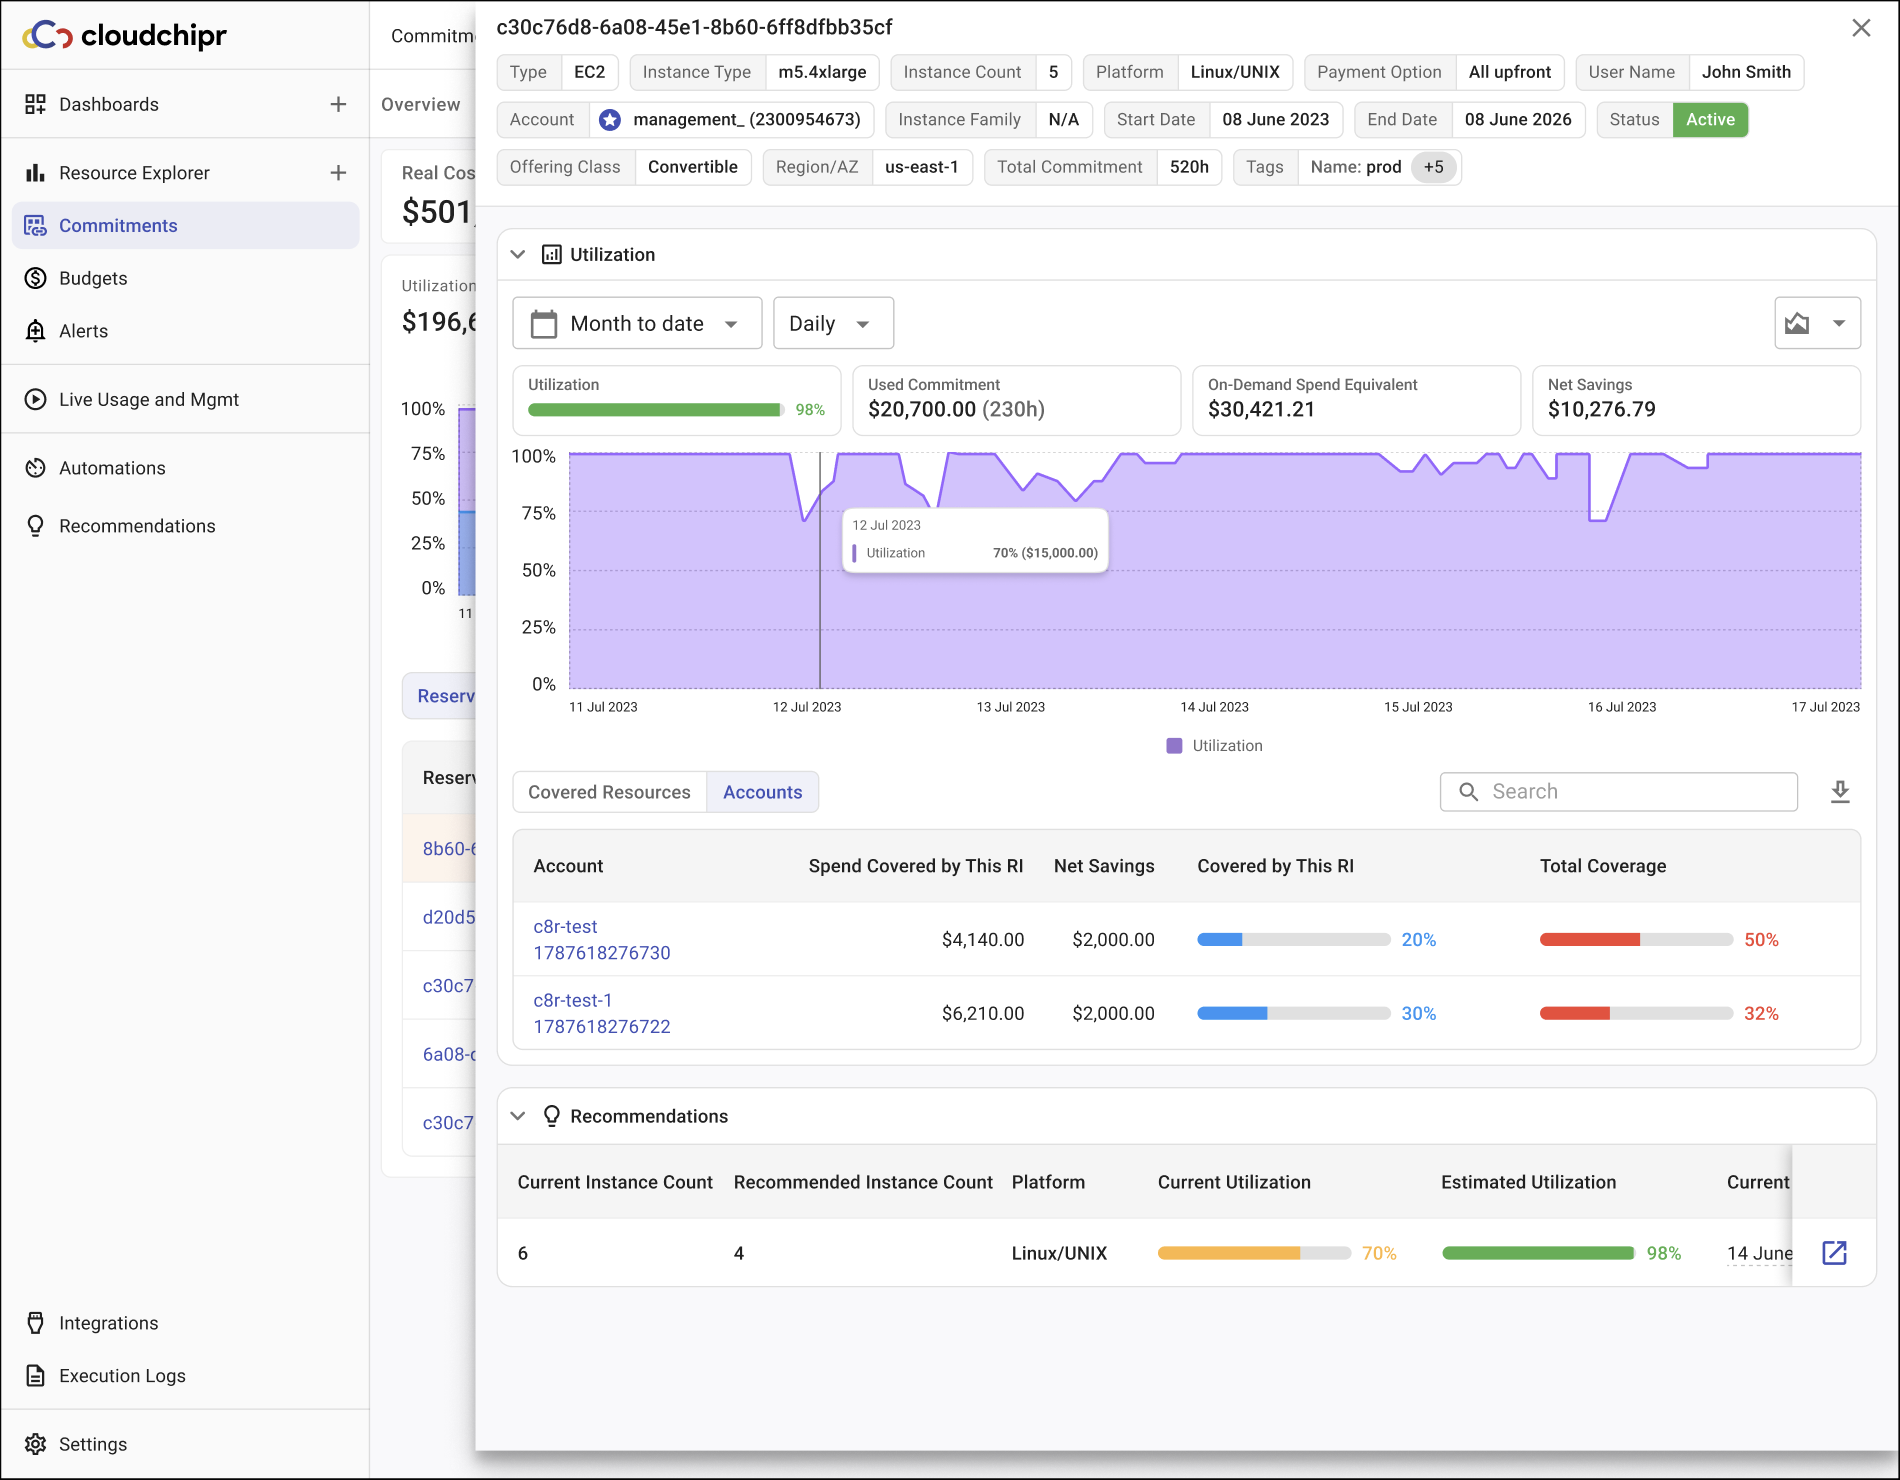
Just like in the Savings Plan feature, you can click on a specific reservation, account, or resource type in the tables to dive into more granular data. This view allows you to understand exactly how well your reservations are performing and where optimizations can be made.
- Reservations: Get a complete view of all your AWS reservation details to better understand your coverage.
- Resource Type/Accounts: View detailed data on how each resource type or account is covered by reservations, including visual metrics and utilization rates.
- View Toggling: Easily switch between different views to gain a comprehensive understanding of your reservation and resource coverage.
- Data Export: Just like with Savings Plans, you can export data to CSV for further analysis and reporting.
With the introduction of the Reservations feature, Cloudchipr continues to help you optimize your AWS environment and ensure you're maximizing your cloud savings.
Alerts: Cost Anomaly Detection
We’ve implemented a new feature that allows users to detect cost anomalies in their cloud expenses, helping them quickly identify unplanned resource usage, such as instances left running after testing.
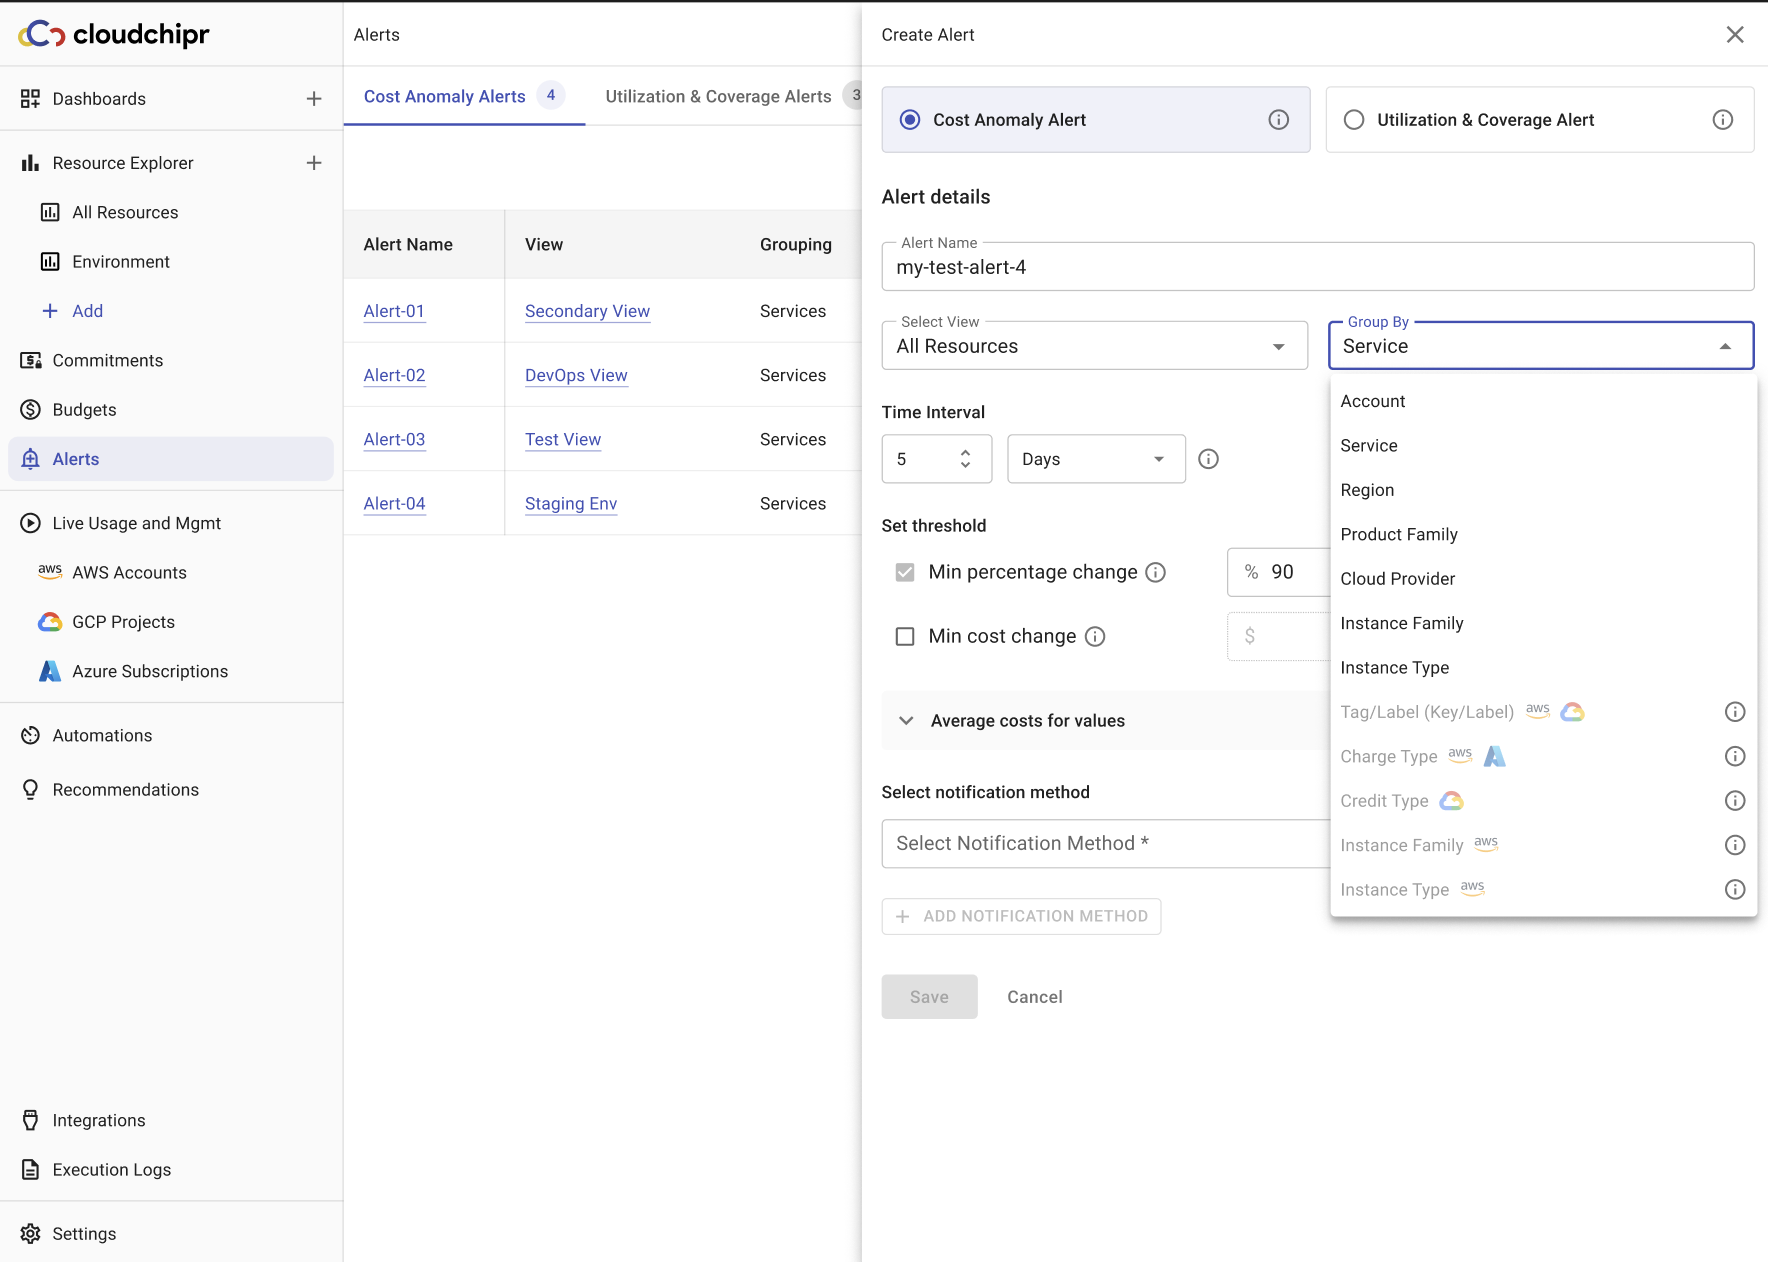
Creating an Alert:
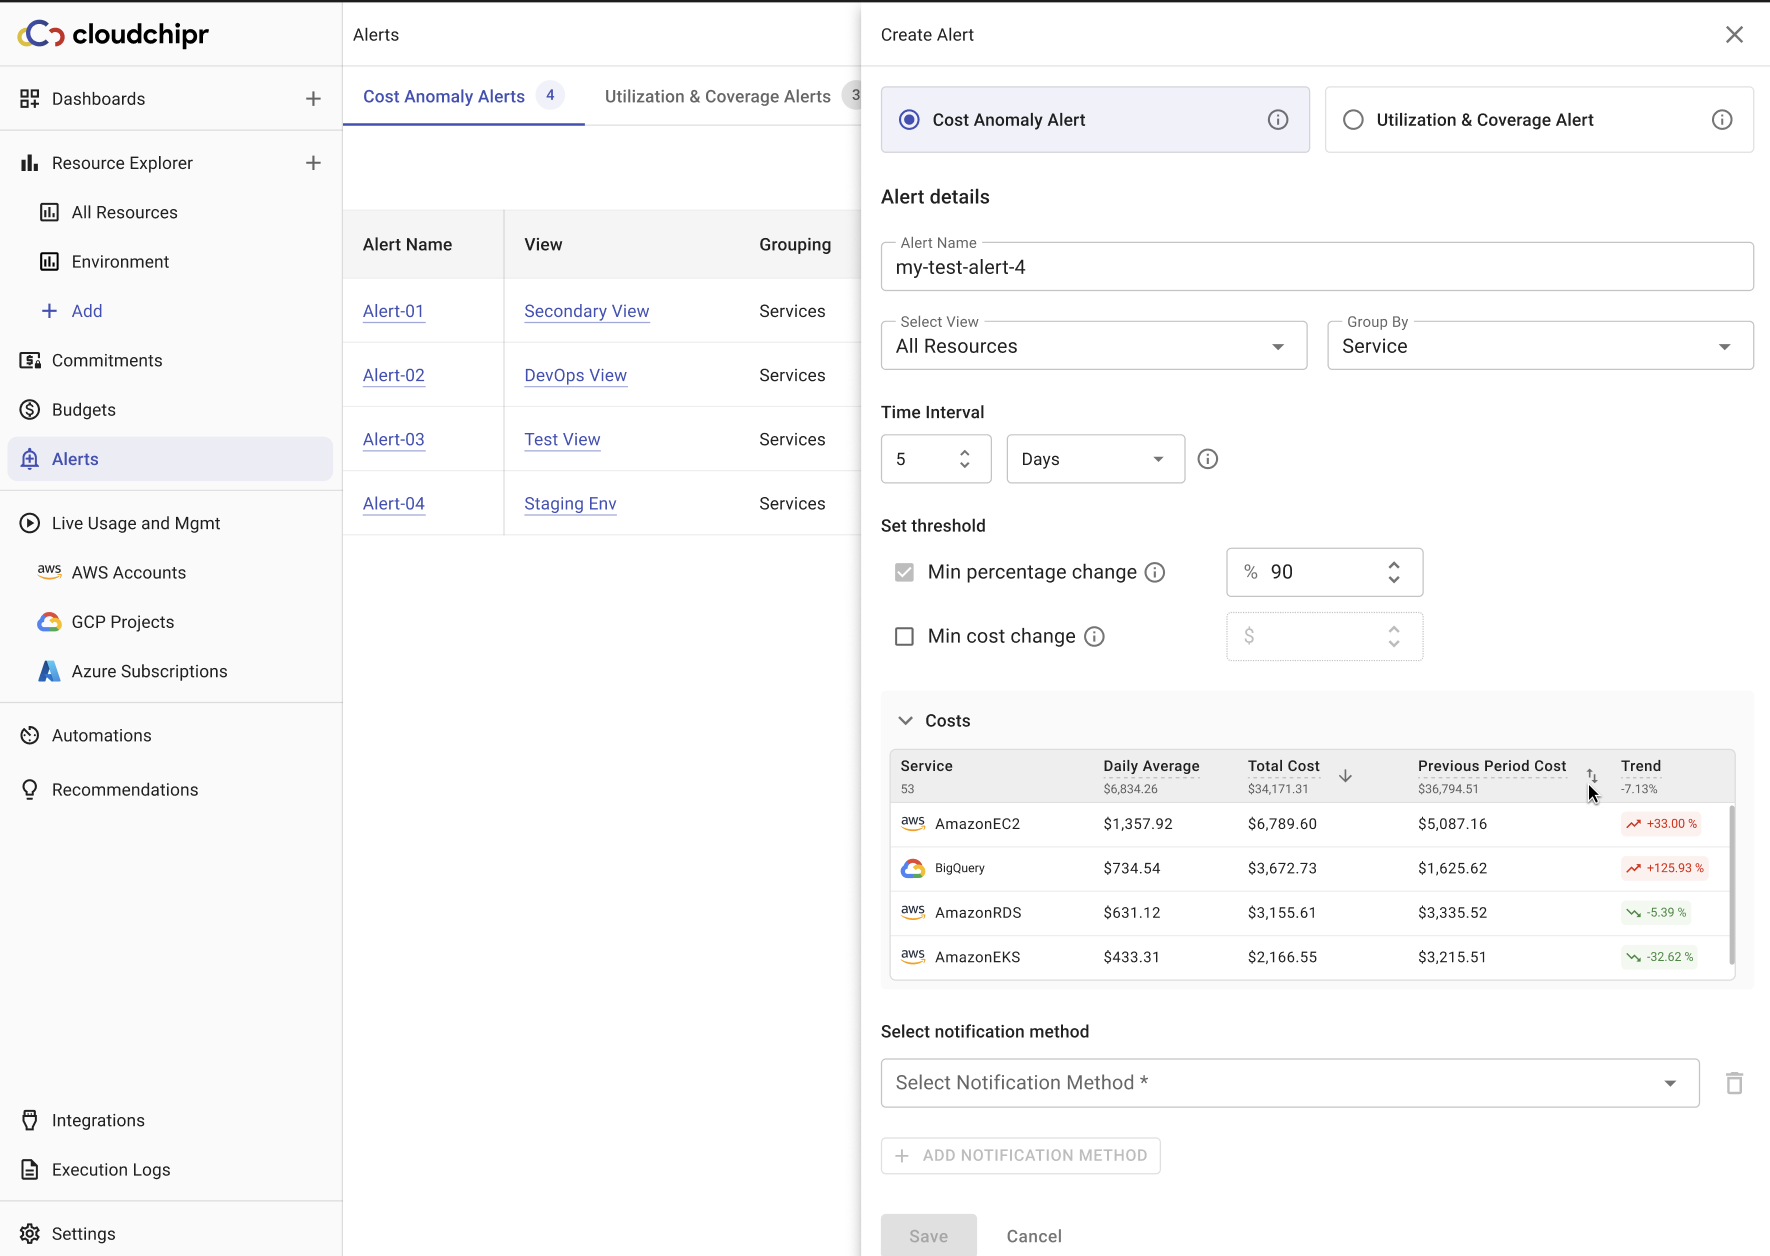
Clicking the Create Alert button opens a configuration drawer where users can follow these steps:
- Select the Alert Type: Choose between Cost Anomaly Alerts or Utilization & Coverage Alerts.
- Set the Alert Name: Provide a unique name for easy identification.
- Select Resource Explorer View: The default view is set to All Resources.
- Choose Grouping: By default, the grouping is set to Services, with other groupings available (except for Resources and Tag Values).
- Specify a Time Interval: Define a comparison period (e.g., 2 days, 1 week, etc.), which will be used to detect anomalies by comparing recent data with prior periods.
- Set a Threshold: Define the minimum percentage change and dollar amount that should trigger the alert (e.g., 20% and $100). These values ensure the detection of both statistically and financially significant anomalies.
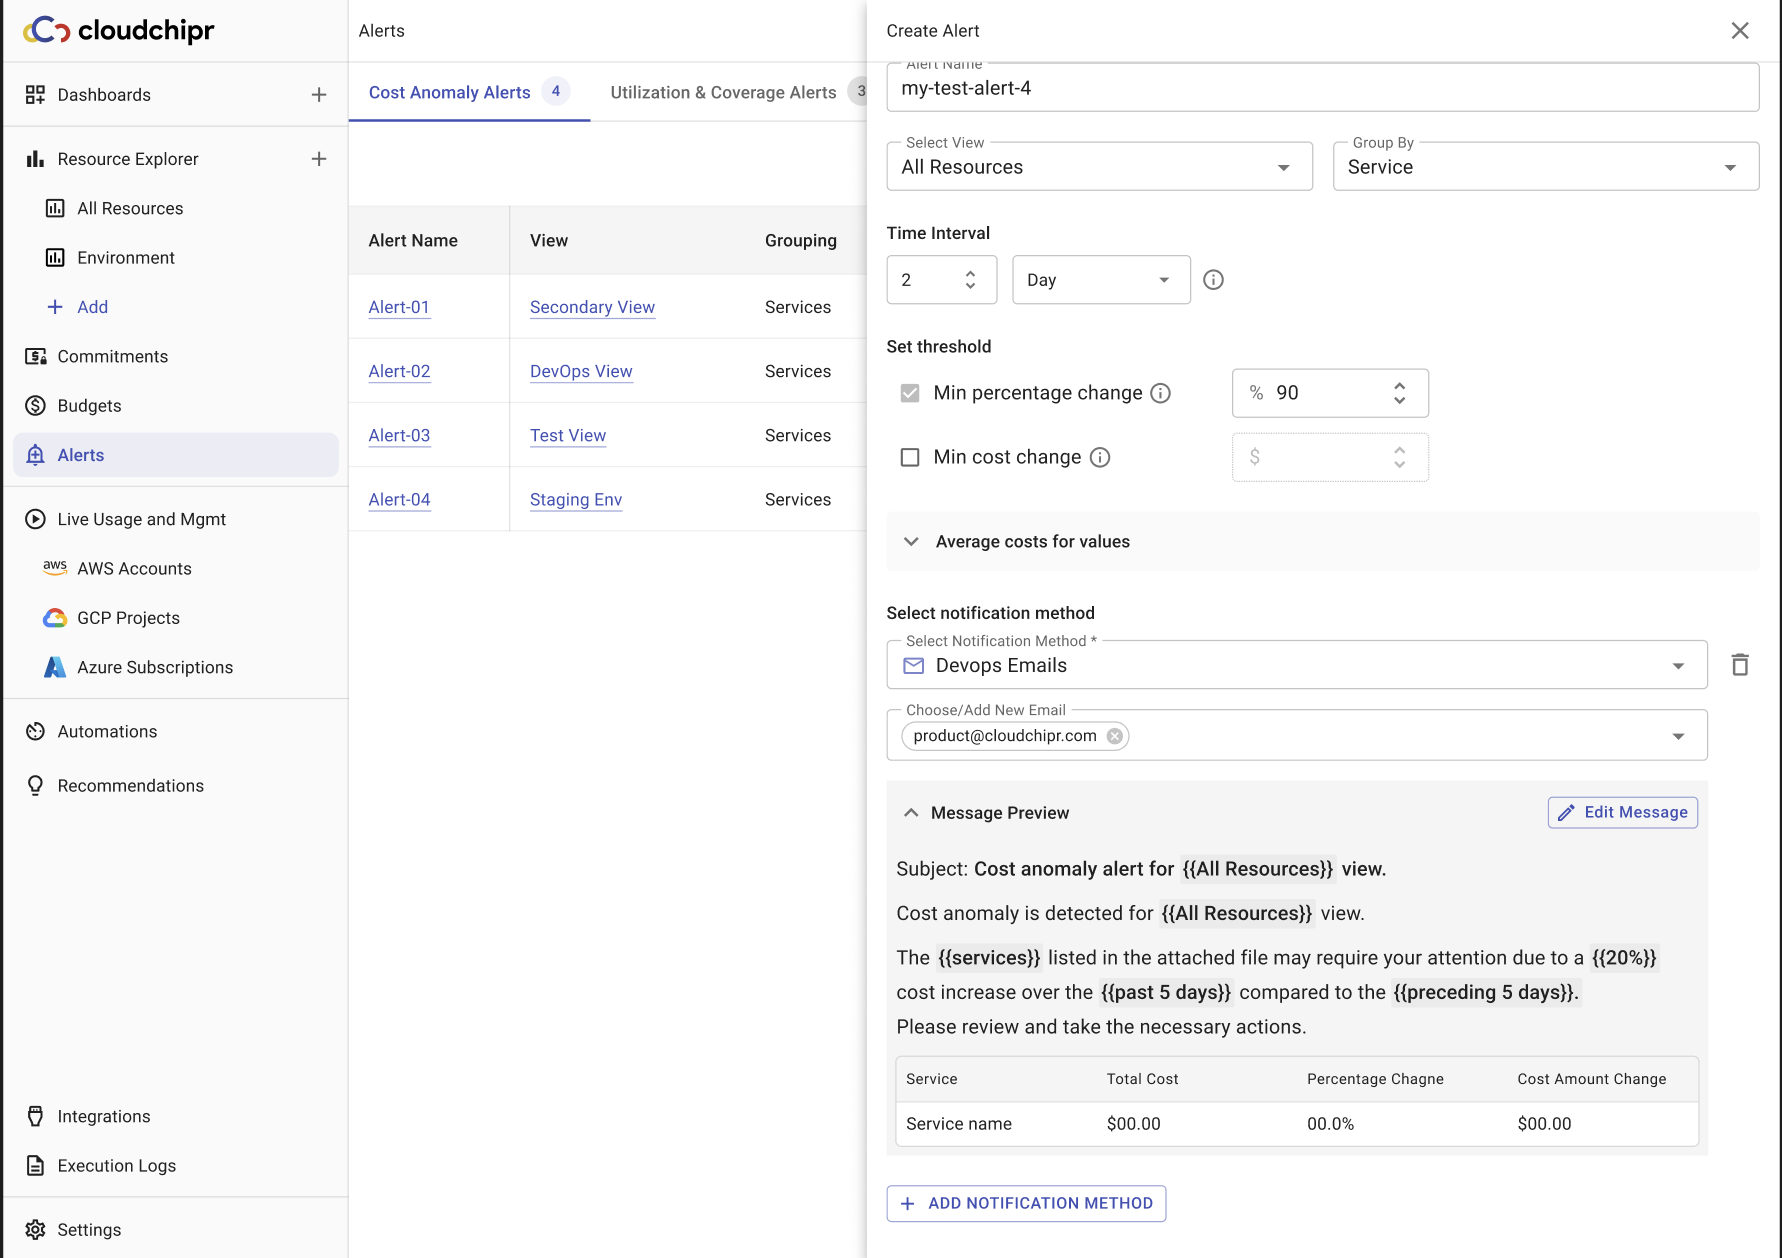
- Additionally, an expandable section under the threshold allows users to view recent spending trends based on the selected time interval, helping them fine-tune the alert settings.
7. Select Notification Method: Users can customize how they wish to be notified when an alert is triggered.
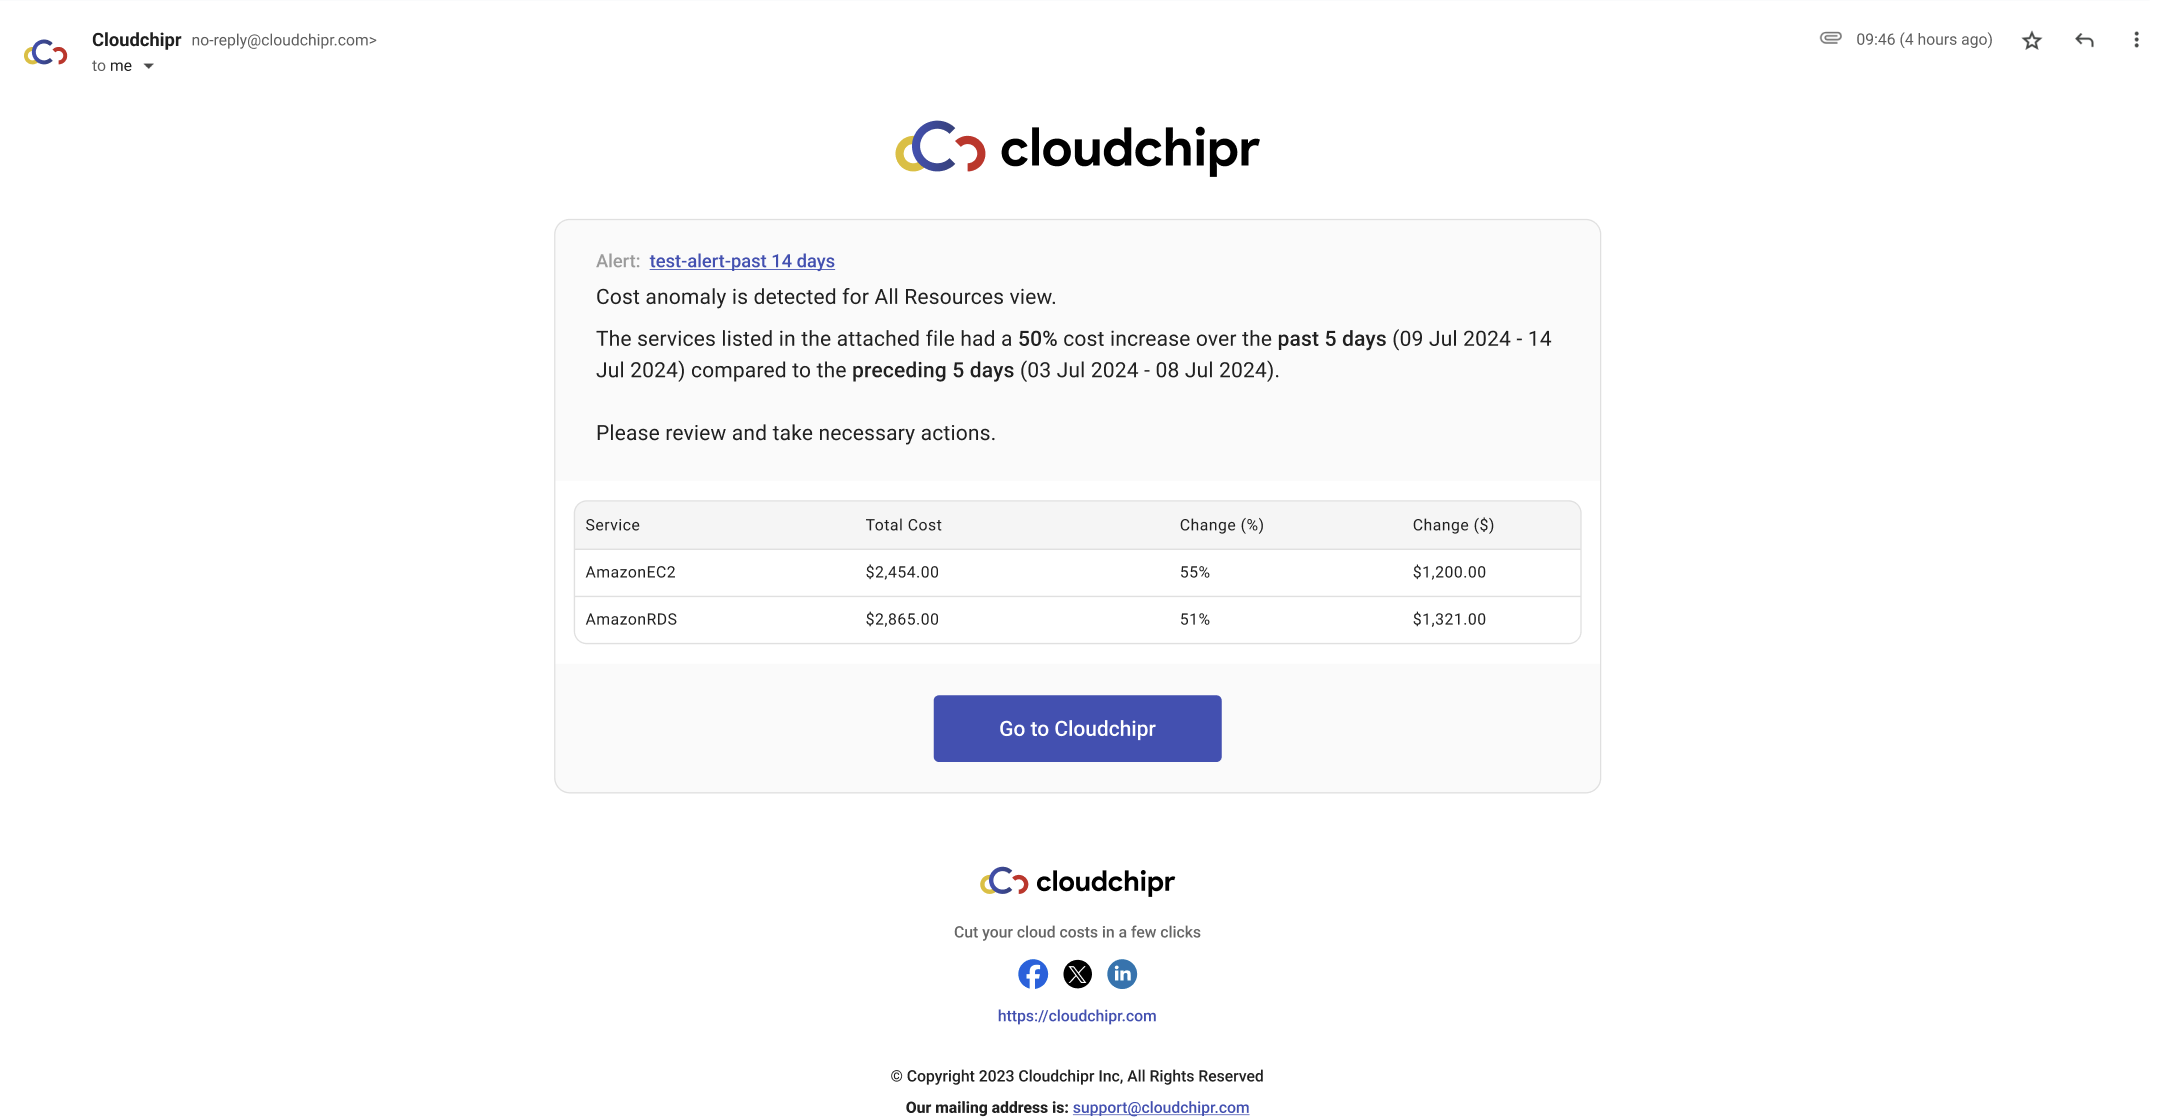
Additionally, when users receive an alert email indicating a cost anomaly, they can navigate directly to the Resource Explorer (RE) via the provided link. The RE view will automatically filter to display data for the specific time interval during which the anomaly occurred and highlight the specific cost changes that triggered the alert. This makes it easy for users to immediately address the issue without manual data filtering.

Private Views for Dashboards and Resource Explorer
To provide more flexibility and comfort when experimenting with data views and filters, Cloudchipr now allows users to control the visibility of their dashboards, Resource Explorer (RE) views, and folders. This update ensures users can freely create and adjust views without worrying about affecting others' work or the overall UI.
How It Works:
- Visibility Options: When creating a new view, dashboard, or folder, users can select whether it will be Visible to Everyone or Visible Only to Me.
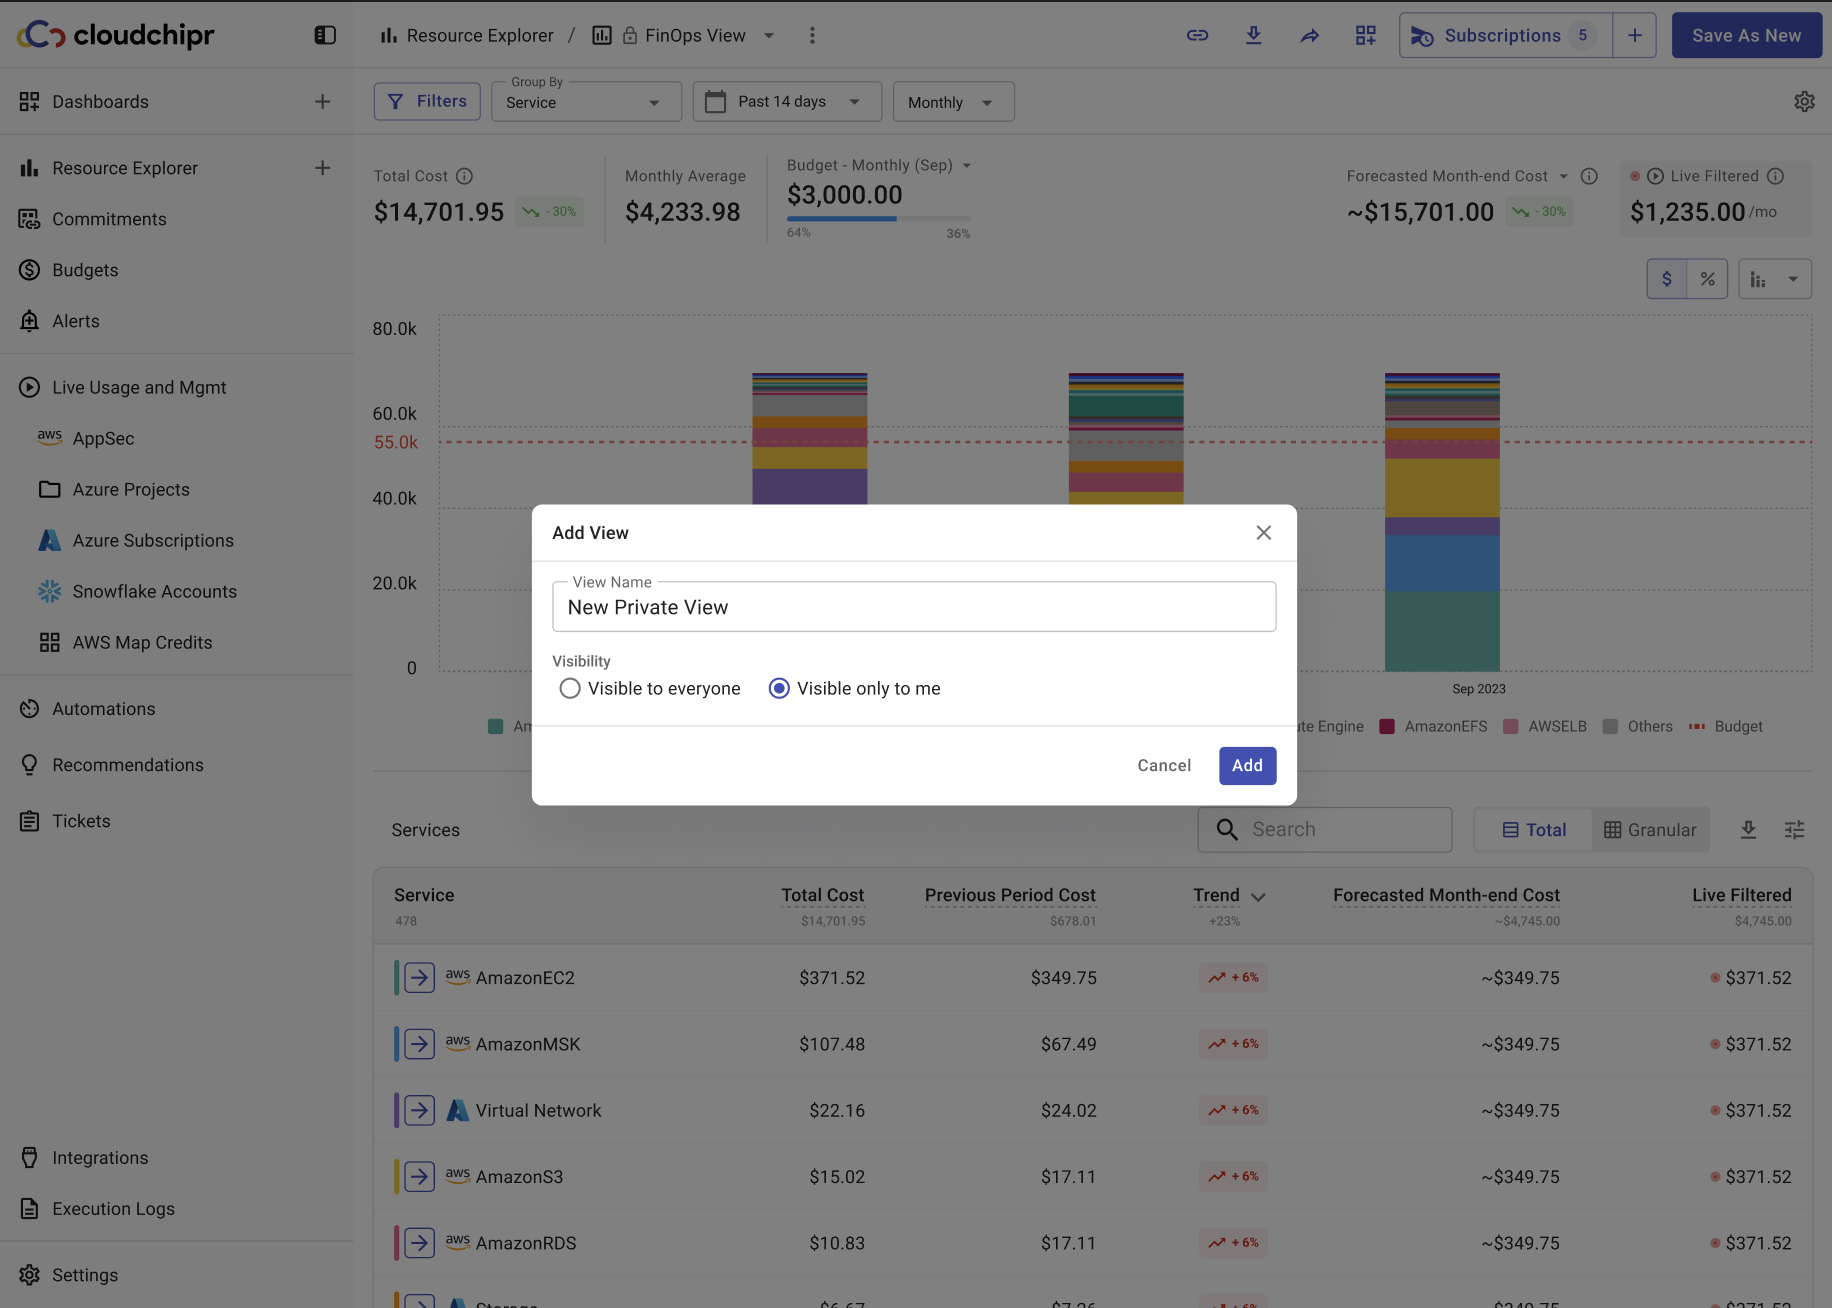
- By default, the visibility is set to Visible to Everyone, but users can choose to make their views private by selecting the Visible Only to Me option.
- Lock Icon: When a view is set to Visible Only to Me, a lock icon will appear next to the item label in the sidebar and breadcrumb, indicating that the view is private.
- Once a view is marked as Visible to Everyone or Visible Only to Me, it cannot be changed back. This ensures that users have control over the visibility of their work from the start.
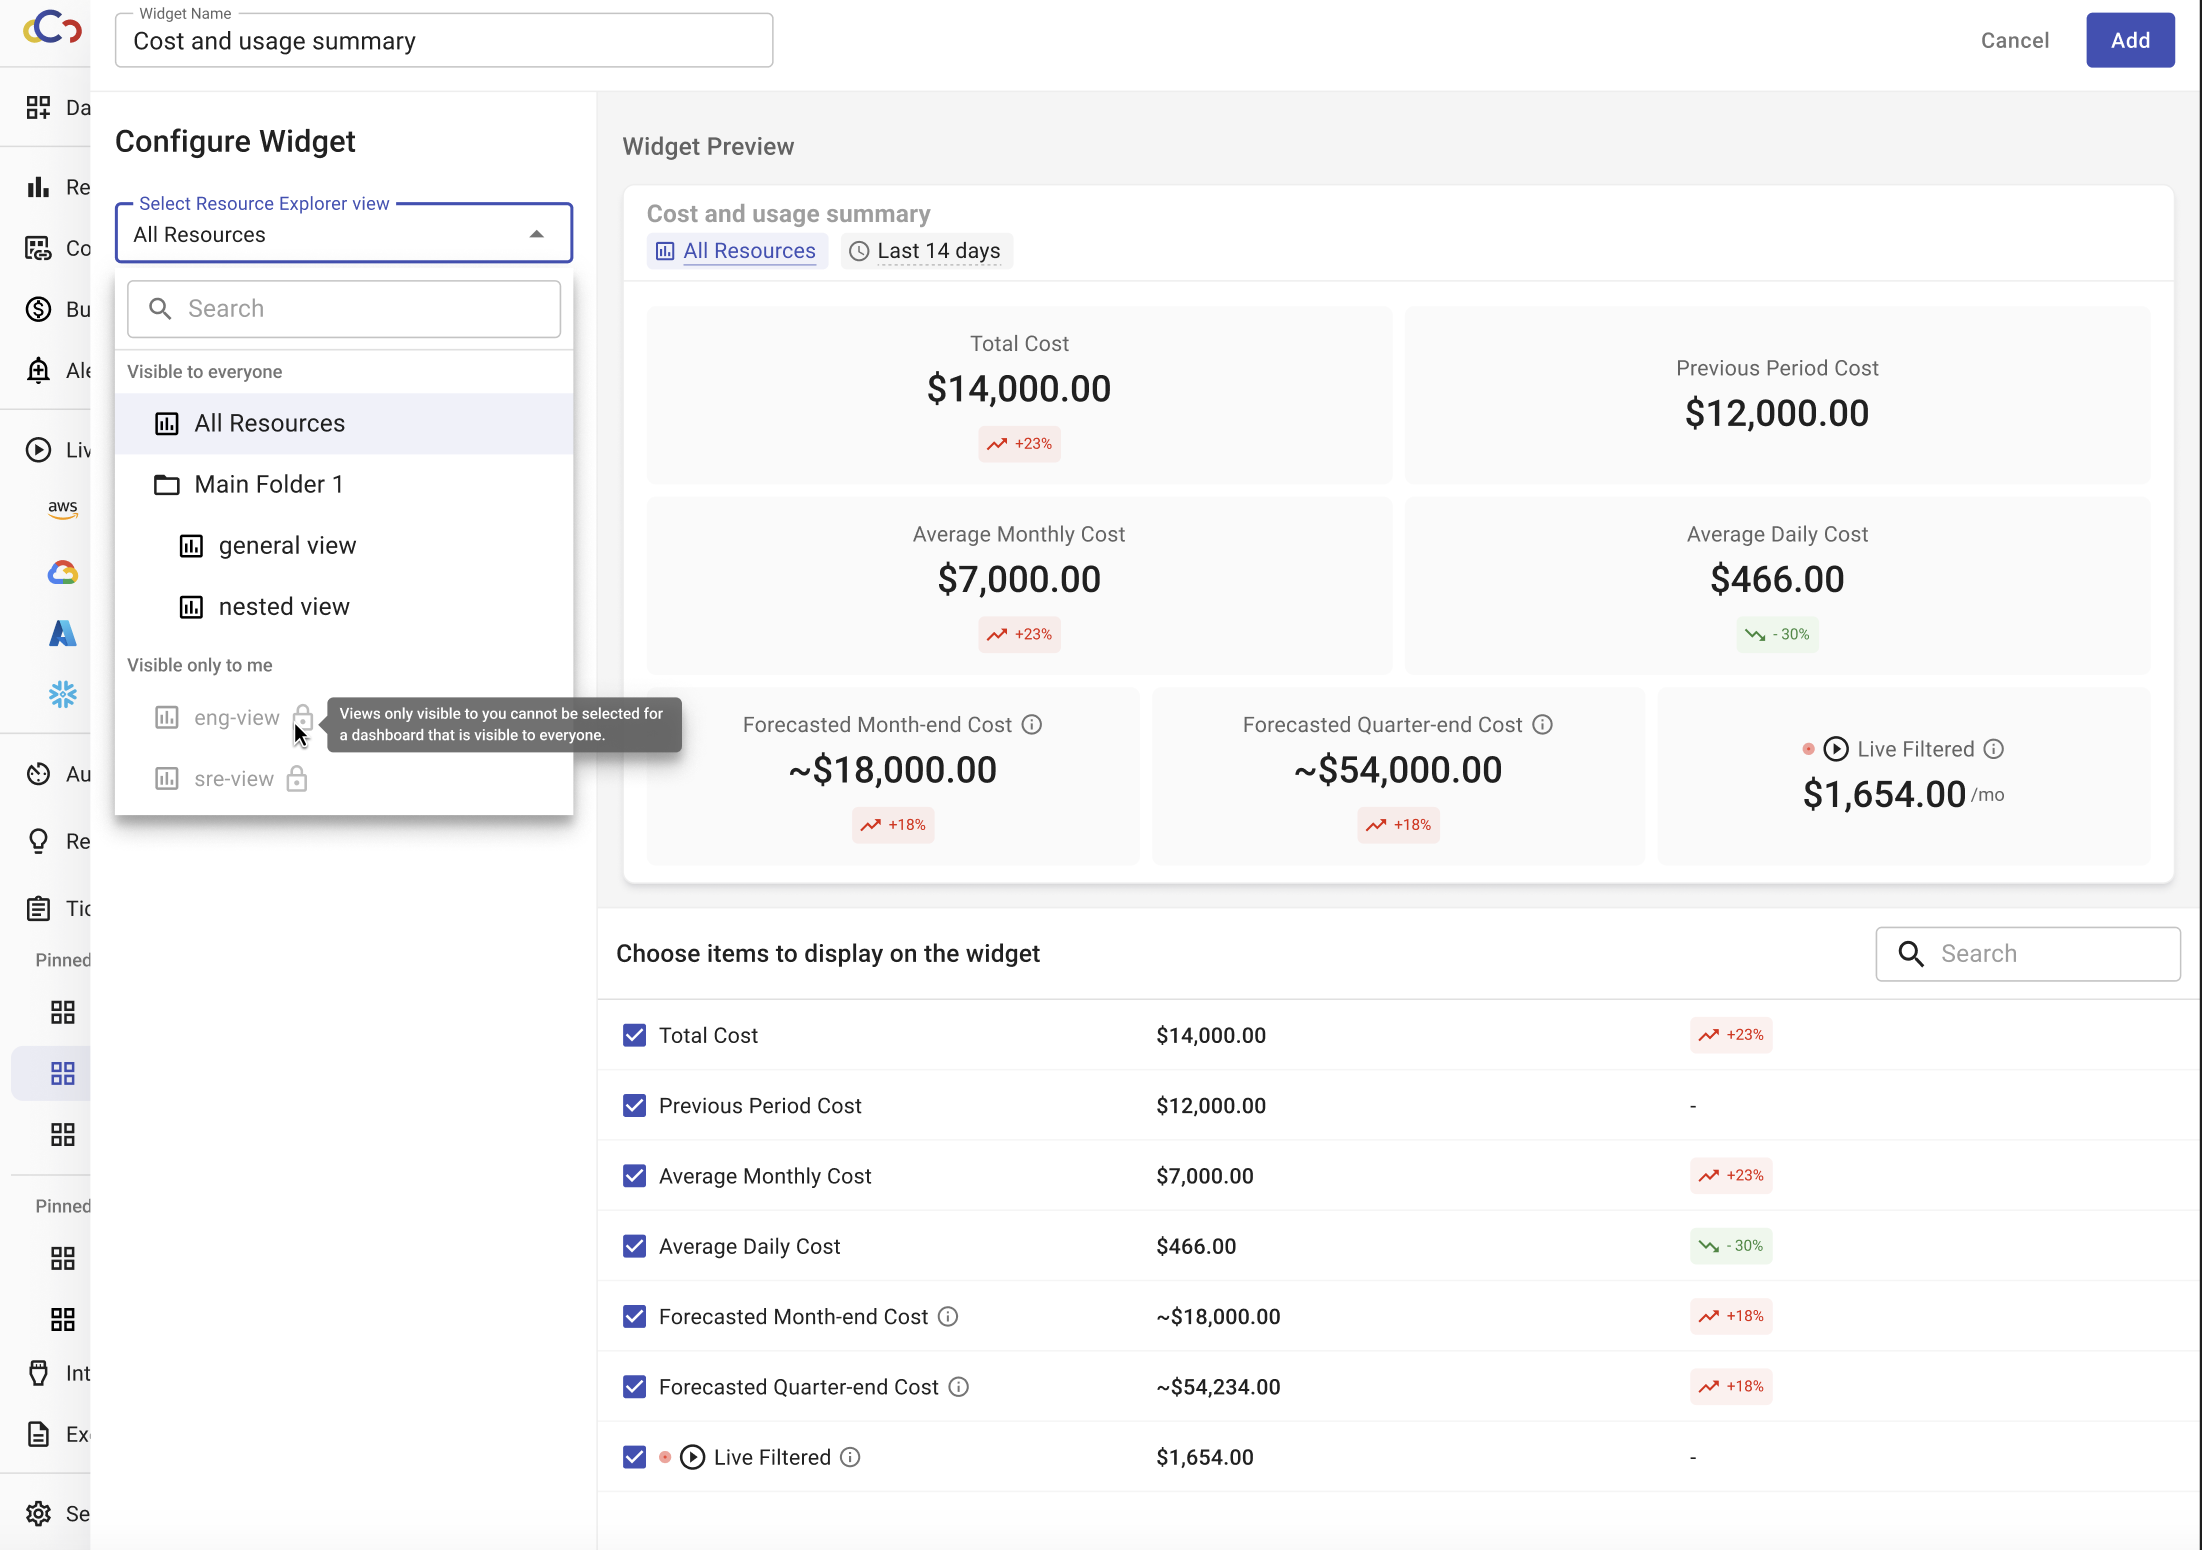
Widget Source Selection:
- When creating a widget in a Visible to Everyone dashboard, only Visible to Everyone views can be selected as a source.
- When creating a widget in a Visible Only to Me dashboard, users can choose from both Visible to Everyone and Visible Only to Me views as sources for the widget.
This update empowers users to experiment with different data presentations without the fear of disrupting others, making the platform even more user-friendly.
As always, in addition to the features above, we have released numerous improvements based on the invaluable feedback from our beloved users 🙂 ❤️ 🎉