AWS NAT Gateway Pricing: Why Your Bill is Spiking and How to Reduce It
.png)
Introduction
NAT Gateway cost spikes are usually not about “more internet traffic.” They are usually about more bytes quietly traversing NAT, which adds a per‑GB data processing charge on top of normal AWS data transfer.
That is why NAT often shows up as a confusing “EC2-Other” increase, even when nothing “obvious” changed.
In this post, you’ll learn how AWS NAT Gateway pricing works, how to quickly prove what is driving the GB processed, and which fixes typically deliver the biggest savings.
What you’ll get:
- A simple mental model for NAT pricing (hours + GB processed + transfer)
- The most common hidden NAT traffic paths (S3, DynamoDB, ECR, patching, telemetry)
- A practical attribution workflow (Cost Explorer → CUR/Athena → VPC Flow Logs)
- High-impact remediation options (gateway endpoints, PrivateLink, per‑AZ NAT, IPv6)
Pricing Model
If you’re here because NAT charges spiked, you’re almost always dealing with data processed (GB).
Engineers expect “egress to the internet” to cost money, but they often miss that NAT Gateway adds its own per‑GB processing charge on top.
What AWS Bills For

For a standard (zonal) NAT Gateway, the model is:
- NAT Gateway-hour: charged for each hour the NAT Gateway is provisioned and available. Partial hours are billed as a full hour.
- Data processing (GB): charged for each GB processed by the NAT Gateway, regardless of the traffic’s source or destination.
- Standard AWS data transfer charges can still apply (for example, data transfer out to the internet, or cross-AZ transfer depending on your routing).
If you use a regional NAT Gateway, you’re billed for each hour the NAT is configured in each Availability Zone (AZ) (for example, spanning three AZs for one hour = three NAT Gateway-hours), plus the same per‑GB processing and standard data transfer charges.
Simple Formula
Use this as your mental model (rates vary by region and can change):
Monthly NAT cost ≈ (NAT hours × hourly rate) + (GB processed × per‑GB processing rate) + (other data transfer charges)
Where:
- NAT hours is the number of billable NAT Gateway-hours (remember partial hours round up).
- GB processed is the total traffic volume that traverses the NAT Gateway (not just “internet egress”).
Worked example (how NAT surprises teams)
A common surprise pattern is private subnets sending traffic to AWS public endpoints (like S3) through NAT. You may see little-to-no “internet egress” change, while NAT data processed grows quickly because the path is through NAT.
Why The Bill Spikes
When NAT costs jump suddenly, the underlying pattern is usually one of these. NAT cost spikes are typically volume-driven, not “NAT is broken.”
High-volume traffic that quietly routes through NAT
Common real-world triggers:
- S3 access from private subnets without an S3 gateway endpoint
- If private route tables send 0.0.0.0/0 to NAT, workloads hitting S3 public endpoints will often traverse NAT.
- DynamoDB access without a DynamoDB gateway endpoint
- Same pattern: missing gateway endpoint means the private workloads may reach public endpoints via NAT.
- Container image pulls (ECR) from private subnets over NAT
- In container-heavy environments, ECR pulls can become a major NAT driver.
- Patch / package traffic
- OS updates, language package managers, base image refreshes, CI runners.
- Log shipping / telemetry egress to external vendors
- Agents forwarding logs/metrics/traces to SaaS endpoints.
Architecture choices that multiply charges
- Centralized NAT across AZs
- If instances and NAT are in different AZs, you can end up with cross-AZ data transfer charges.
- One NAT per AZ (zonal) vs regional NAT gateway
- Zonal designs typically keep traffic in‑AZ (good for avoiding cross‑AZ transfer), at the expense of more hourly NAT gateways.
- Idle NAT gateways left behind
- Even with near‑zero traffic, NAT Gateway-hours accrue while the gateway exists.
How To Prove What’s Causing It
The goal is attribution in layers: cost line item → NAT gateway(s) → source subnets/instances/tasks → destination services/domains.
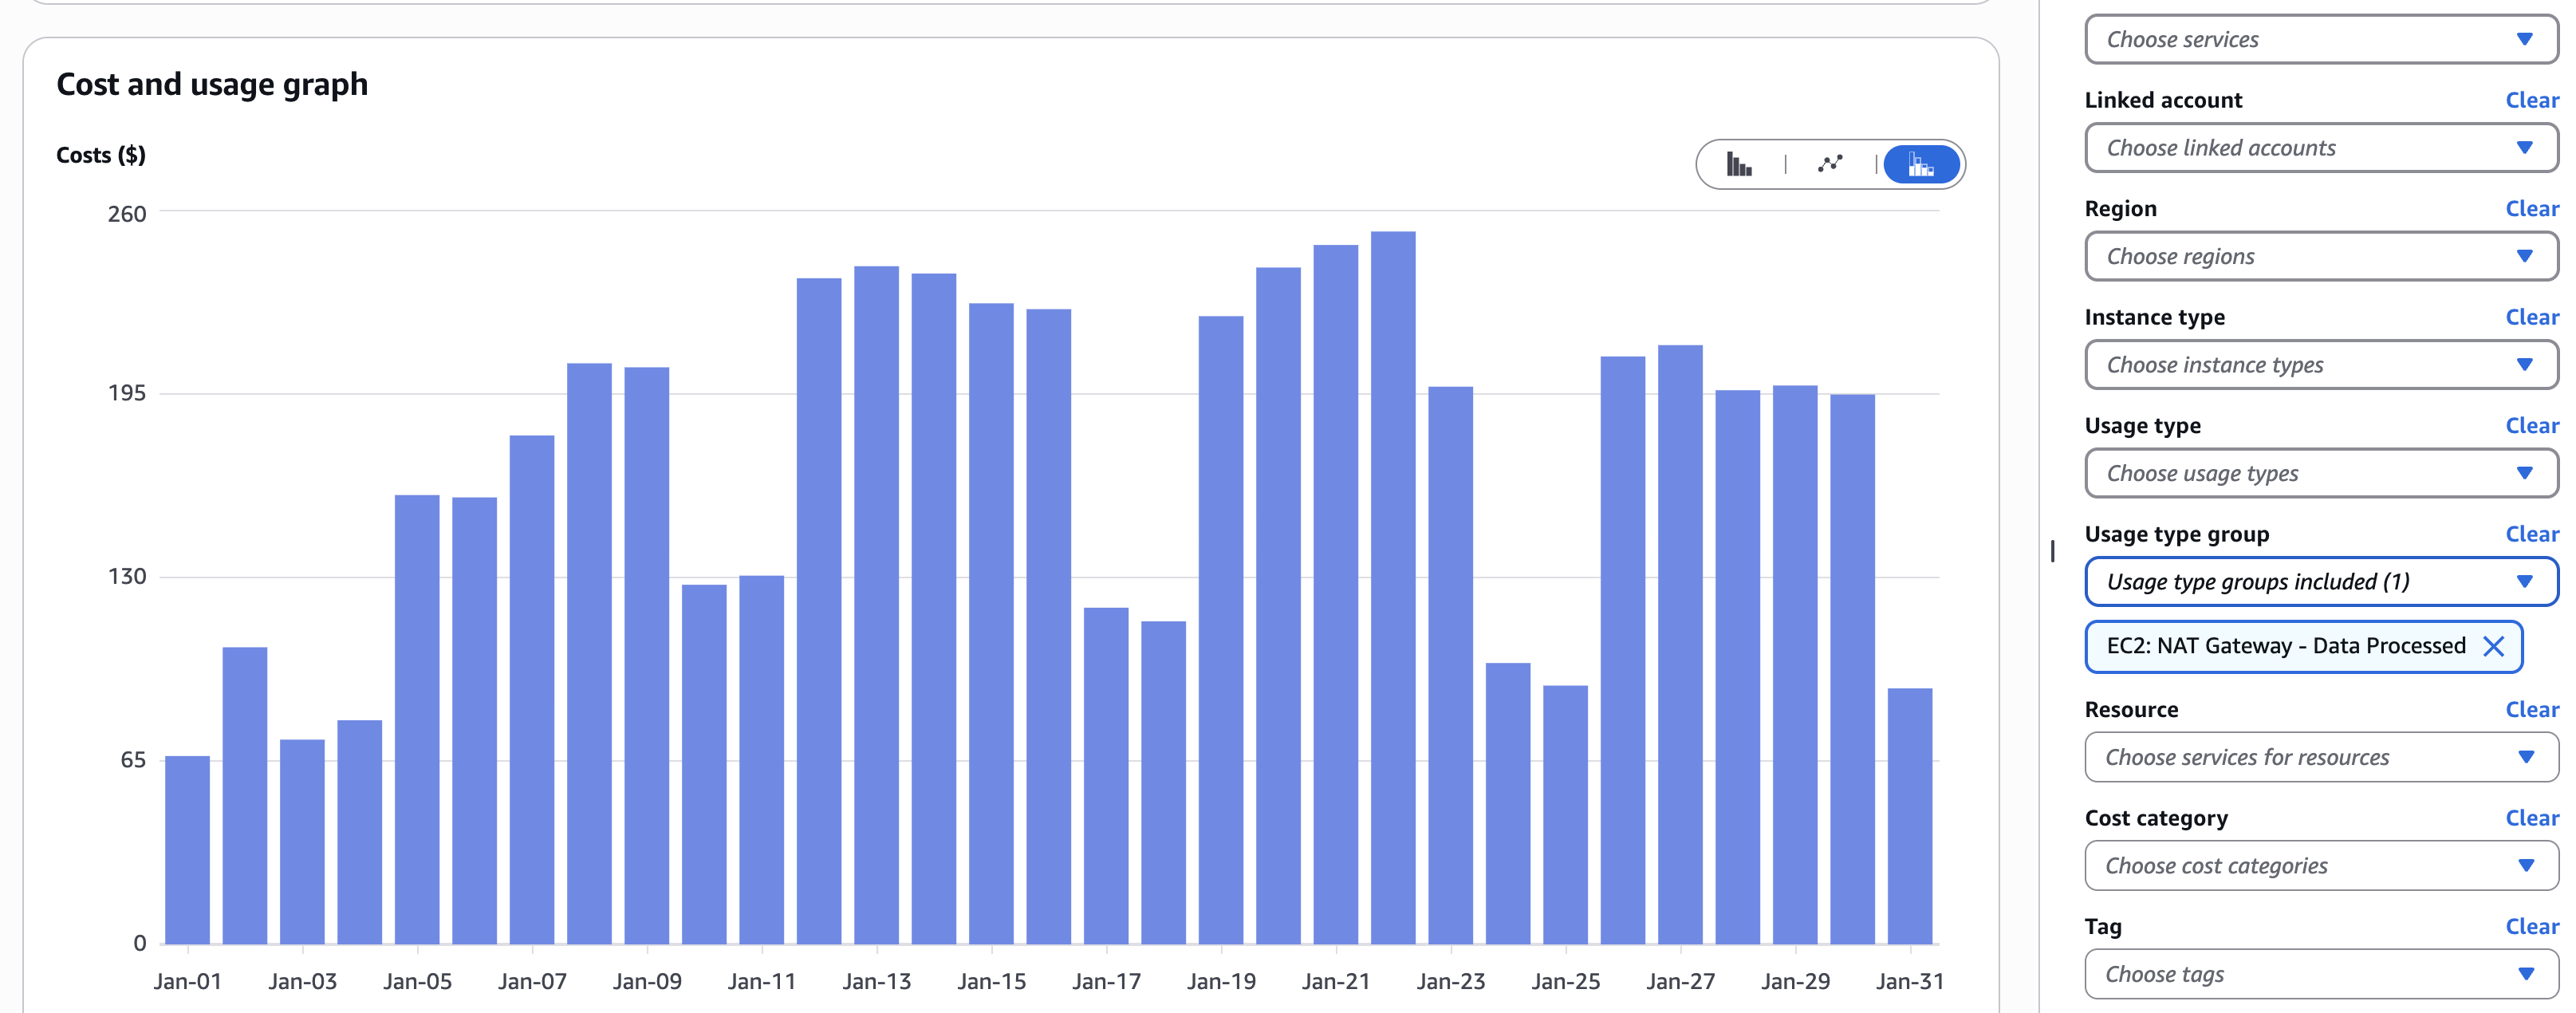
Cost Explorer triage (fastest signal)
Start in AWS Cost Explorer:
- Filter by:
- Region
- Service / usage type (NAT often appears under “EC2-Other” depending on the line item)
- Group by Usage type or Usage type group.
- Look for a clear split between:
- “hours” style usage groups (your baseline)
- “bytes/GB processed” style usage groups (usually the spike)
CUR and Athena (resource and workload attribution)
Cost Explorer tells you “what category” is expensive.
A Cost and Usage Report (CUR) + Athena can tell you “which resources and tags” are attached to those costs.
Below is a practical starting query. It uses a broad match because exact strings vary across regions and schemas.
-- Replace cur_database.cur_table with your CUR database/table.
-- Goal: find the biggest NAT-related line items (by cost) and see if resource IDs/tags exist.

SELECT
  line_item_resource_id,
  line_item_usage_type,
  SUM(CAST(line_item_usage_amount AS DOUBLE))       AS usage_amount,
  SUM(CAST(line_item_unblended_cost AS DOUBLE))     AS unblended_cost,
  MAX(resource_tags)                                AS resource_tags_sample
FROM cur_database.cur_table
WHERE
  line_item_usage_type LIKE '%NatGateway%'
  AND CAST(line_item_unblended_cost AS DOUBLE) > 0
GROUP BY 1, 2
ORDER BY unblended_cost DESC
LIMIT 50;
If line_item_resource_id is blank, that often means the usage type isn’t directly attributable to a single resource ID. In that case, Flow Logs correlation is usually the bridge from “cost bucket” to “who generated the bytes.”
VPC Flow Logs (prove the traffic path and top talkers)

VPC Flow Logs capture traffic metadata for network interfaces in your VPC and can be published to CloudWatch Logs, S3, or Firehose.
Two practical approaches:
Option A: Log the NAT gateway ENIs (zonal NAT) or NAT resource-id (regional NAT)
This helps you answer:
- Which private source IPs produced the most bytes through NAT?
- Which destinations (IPs/ports) are responsible?
Option B: Log the private subnets or VPC, then filter for NAT-shaped traffic
Fields that matter for NAT cost debugging:
bytesandpackets(volume)pkt-srcaddr/pkt-dstaddrto distinguish original endpoints when intermediate interfaces (like NAT gateway ENIs) are involvedpkt-dst-aws-service(when available) to identify AWS service destinations
Example Athena query shape (adjust to your schema):
SELECT
  pkt_srcaddr        AS src_ip,
  pkt_dstaddr        AS dst_ip,
  dstport,
  SUM(bytes)         AS total_bytes
FROM vpc_flow_logs
WHERE
  interface_id IN ('eni-aaa...', 'eni-bbb...')
  AND action = 'ACCEPT'
  AND day = '2026-02-24'
GROUP BY 1,2,3
ORDER BY total_bytes DESC
LIMIT 50;
Make attribution repeatable
- Tag NAT gateways (owner/app/env) and enforce tag policies.
- Activate and use cost allocation tags so finance and engineering can slice NAT spend consistently.
- Map NAT gateways → subnets → route tables so you can quickly identify which subnets will “leak” traffic through NAT.
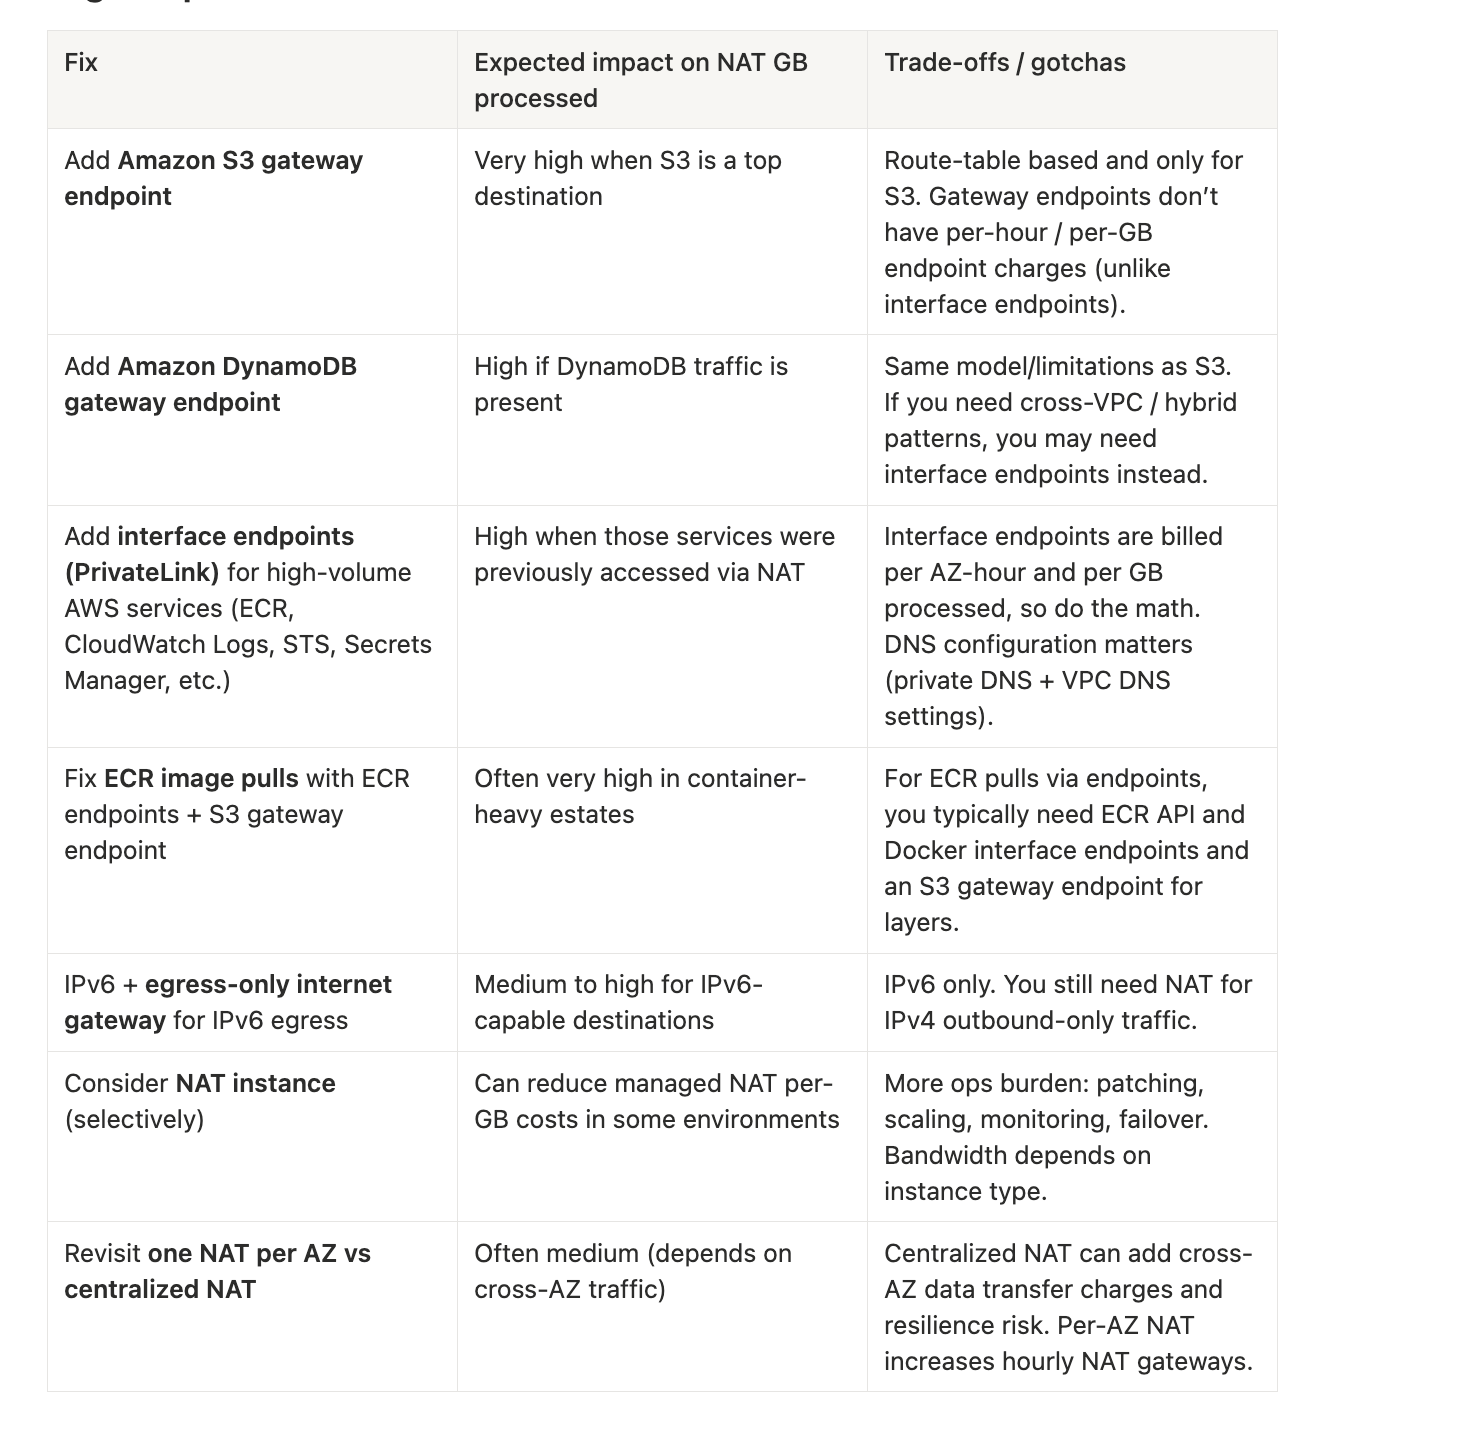
How To Reduce NAT Gateway Costs
Real savings come from:
- removing avoidable NAT traffic for AWS services,
- shrinking internet-bound egress volume, and
- choosing the right HA design (AZ-local vs centralized) for your constraints.
High-Impact Fixes And Trade-Offs
FAQ
What is AWS NAT Gateway pricing, exactly?
NAT Gateway pricing includes an hourly charge for each NAT Gateway-hour the gateway is available and a data processing charge per GB processed, plus standard AWS data transfer charges. Rates vary by region.
Why did my NAT Gateway bill spike even though I didn’t increase internet traffic?
Because the per‑GB data processing meter applies regardless of traffic source/destination. Depending on routing, AWS service traffic (like S3) can still traverse NAT.
Does NAT Gateway charge for traffic to S3?
If S3 traffic is routed through a NAT gateway, it incurs NAT hourly and data processing charges. Routing S3 through a gateway endpoint can remove that traffic from the NAT path.
How do I attribute NAT Gateway charges to specific workloads?
Use layered attribution: Cost Explorer to isolate NAT-related usage types, CUR + Athena to identify top usage types and any available resource IDs/tags, then VPC Flow Logs to map bytes back to sources and destinations.
Are VPC gateway endpoints free, and do they reduce NAT costs?
For S3 and DynamoDB, gateway endpoints do not have per-hour / per-GB endpoint charges, and routing those services through endpoints typically reduces NAT “data processed” bytes for those paths.
When is an interface endpoint (PrivateLink) cheaper than NAT?
Interface endpoints have per‑AZ hourly charges and per‑GB processing charges. They can still be cheaper than NAT when you have large, steady volumes to a service and want to stop paying NAT processing for that path.