Best Cloud Observability Tools 2026
.png)
Introduction: What Is Cloud Observability?
Cloud observability refers to the ability to understand the internal state of complex cloud systems by collecting and analyzing their external outputs – primarily logs, metrics, and traces. In practice, an observability platform centralizes these telemetry signals to provide deep visibility into applications and infrastructure. Unlike traditional monitoring (which might tell you what issue occurred), observability tools help you explore why it happened by correlating diverse data in context.
Cloud-native architectures (microservices, containers, serverless, etc.) have made systems more dynamic and distributed, increasing the importance of robust observability. Modern observability solutions unify data across stacks – infrastructure metrics, application traces, log events, user experience stats – so teams can quickly pinpoint root causes and performance bottlenecks. This guide is for engineering leaders, SREs, DevOps engineers, and platform teams evaluating the best observability tools available as of late 2025 to improve cloud visibility and reliability in their organizations. We’ll explain key concepts of cloud observability, then compare leading observability platforms and their features.
How We Evaluated These Vendors
Choosing a “best” observability solution depends on many factors. We assessed vendors against a broad set of criteria to ensure a fair comparison:
- Telemetry Coverage (MELT): Support for Metrics, Events, Logs, Traces – the core data pillars of observability. Top platforms ingest system metrics, application traces, log data, and even user experience events or profiles in one place.
- OpenTelemetry & Open Standards: Compatibility with OpenTelemetry (OTel) for vendor-neutral instrumentation. We favored tools that can ingest OTLP data and work with open-source ecosystems (Prometheus, Fluentd, etc.), avoiding lock-in.
- APM and Distributed Tracing: Depth of Application Performance Monitoring – e.g. code-level visibility, transaction profiling, distributed tracing across services, and how well the tool visualizes trace spans (service maps, dependency graphs).
- Log Management & Analytics: Capabilities for log aggregation, indexing or storage, fast search (with query languages like Splunk’s SPL or Elastic’s Lucene), and context linking between logs and other signals.
- Dashboards & Visualization: Quality of dashboards and UI – customizable visualizations, out-of-the-box templates, cross-source correlation in the interface (e.g. clicking from a spike in metrics to related traces or logs).
- Alerting & SLOs: Robust alerting mechanisms, including support for multi-condition alerts, anomaly detection (AI-driven alerts), and SLO (Service Level Objective) tracking and error budgeting for reliability management.
- Integrations & Ecosystem: Pre-built integrations with cloud platforms (AWS, Azure, GCP), containers (Kubernetes), databases, middleware, etc. Also integration with incident management or CI/CD tools. A rich integration library is a strength.
- Data Retention & Scalability: How the platform handles data growth – retention policies, tiered storage options, and ability to scale to high ingest rates and cardinality. We looked at whether the solution has been proven at large scale (multi-terabyte/day).
- Cost Model: Pricing and licensing approach – e.g. per host, per GB ingested, or per user. We considered transparency and “surprise factor” (some tools are notorious for complex, unpredictable bills). Cost efficiency features like data sampling or retention tuning were noted.
- Usability & Deployment: Ease of setup (agents, auto-instrumentation, cloud deployment options) and learning curve of the tool. A clean UI/UX and accessible query languages are positives; steep learning or heavy management overhead are negatives.
- Governance & Compliance: Features for access control (RBAC, multi-tenancy), data encryption, and industry compliance (e.g. SOC 2, GDPR, FedRAMP) for enterprises in regulated sectors.
Each vendor profile below highlights how they measure up on these criteria, along with specific strengths and cautions.
Vendor Deep Dives
Below we dive into each vendor with an overview, key capabilities, pros/cons, ideal use cases, and some questions to ask before buying. This will help you match each observability solution to your requirements.
Datadog
.webp)
Overview: Datadog is a market-leading SaaS observability platform (founded 2010) known for its breadth of coverage. It provides end-to-end visibility across infrastructure, applications, containers, logs, and user experience. With over 600 built-in integrations, Datadog can monitor nearly every component of a modern tech stack, from AWS services to Kubernetes to databases. Its unified dashboarding and analytics make it a popular choice for organizations consolidating monitoring tools.
Key Capabilities:
- Unified Platform: Single-pane visibility into servers, VMs, containers, cloud services, applications, networks, and more. Infrastructure metrics, APM traces, logs, and even security signals are all integrated.
- Extensive Integrations: Supports 600+ technologies out-of-the-box - including cloud provider services, orchestration platforms, databases, web servers, and custom apps - via agents or API.
- Powerful Dashboards & Alerts: Real-time interactive dashboards and visualizations; drag-and-drop widgets. Rich alerting with threshold, anomaly, and forecast alerts. Collaboration features (shareable dashboards, commenting) for team visibility.
- APM and Tracing: Comprehensive APM for many languages, offering code-level performance profiling and distributed tracing. One-click context jumping from an error trace to related logs or infrastructure metrics for rapid root cause analysis.
- User Experience Monitoring: Includes RUM (Real User Monitoring) for front-end performance, synthetic monitoring for uptime checks, mobile app monitoring, and more – allowing correlation of backend performance with end-user impact.
Pros:
- All-in-One Solution: Extremely broad feature set - infrastructure monitoring, logging, APM, network monitoring, and even cloud security - in one platform. Teams can eliminate multiple point tools.
- Mature and Polished: Over a decade of refinement, with a rich UI and stable, scalable backend. Dashboards and analytics are robust and well-designed. Many integrations come with pre-built dashboards for quick insights.
- Correlation Across Silos: Excels at correlating data from different sources. For example, you can trace a single user request through front-end timings, back-end service traces, database metrics, and log events in a connected view. This context speeds up troubleshooting.
- Managed SaaS Convenience: Fully cloud-hosted (though on-premises agent data) – Datadog handles scaling and updates of the platform. This reduces operational overhead compared to self-hosted stacks.
Cons:
- Cost Complexity: Datadog's pricing is notoriously complex and can become astronomical at scale. Charges are per host for infrastructure, plus additional charges per million log events, per traced span, per custom metric, etc. It's easy to under-estimate costs and get surprise bills if usage isn't tightly controlled.
- Proprietary Lock-In: While Datadog supports OpenTelemetry data input, under the hood it converts everything to its proprietary format. Its agents and client libraries are custom. Migrating off Datadog can require re-instrumenting your apps, which is a form of vendor lock-in.
- Signal Noise at Scale: With so much data, teams often face “dashboard sprawl” or alert fatigue if they enable everything. Careful tuning is required to avoid overwhelming noise. The platform’s sheer breadth can be overkill for small, simple environments.
Ideal For: Teams that want a one-stop, unified observability platform and have the budget to support it. Common in mid-to-large organizations with complex, cloud-centric stacks where consolidating monitoring tools is a priority. Great for DevOps teams that value quick setup and rich features over cost sensitivity.
Questions to Ask Before Buying:
- "Can we afford Datadog at our scale?" - Request a detailed pricing breakdown based on your telemetry volumes (hosts, containers, log throughput, APM spans) and model out worst-case costs. Ask about volume discounts or custom pricing if you expect large usage.
- “How will we handle data retention and sampling?” – Discuss data retention policies for metrics, logs, and traces. For example, will you drop or downsample high-cardinality metrics? How long will full-resolution traces be kept? Cost control often means adjusting what data is indexed.
- “Does Datadog support all our tech stack out-of-the-box?” – Verify integration support for any less-common technologies you use. While Datadog has hundreds of integrations, ensure your critical components (frameworks, databases, etc.) have coverage or see if custom integration is needed.
- “What is the onboarding and training plan?” – Given the platform’s scope, ask about training resources for your team. Consider starting with a trial or pilot on a subset of systems to build familiarity without overspending.
New Relic
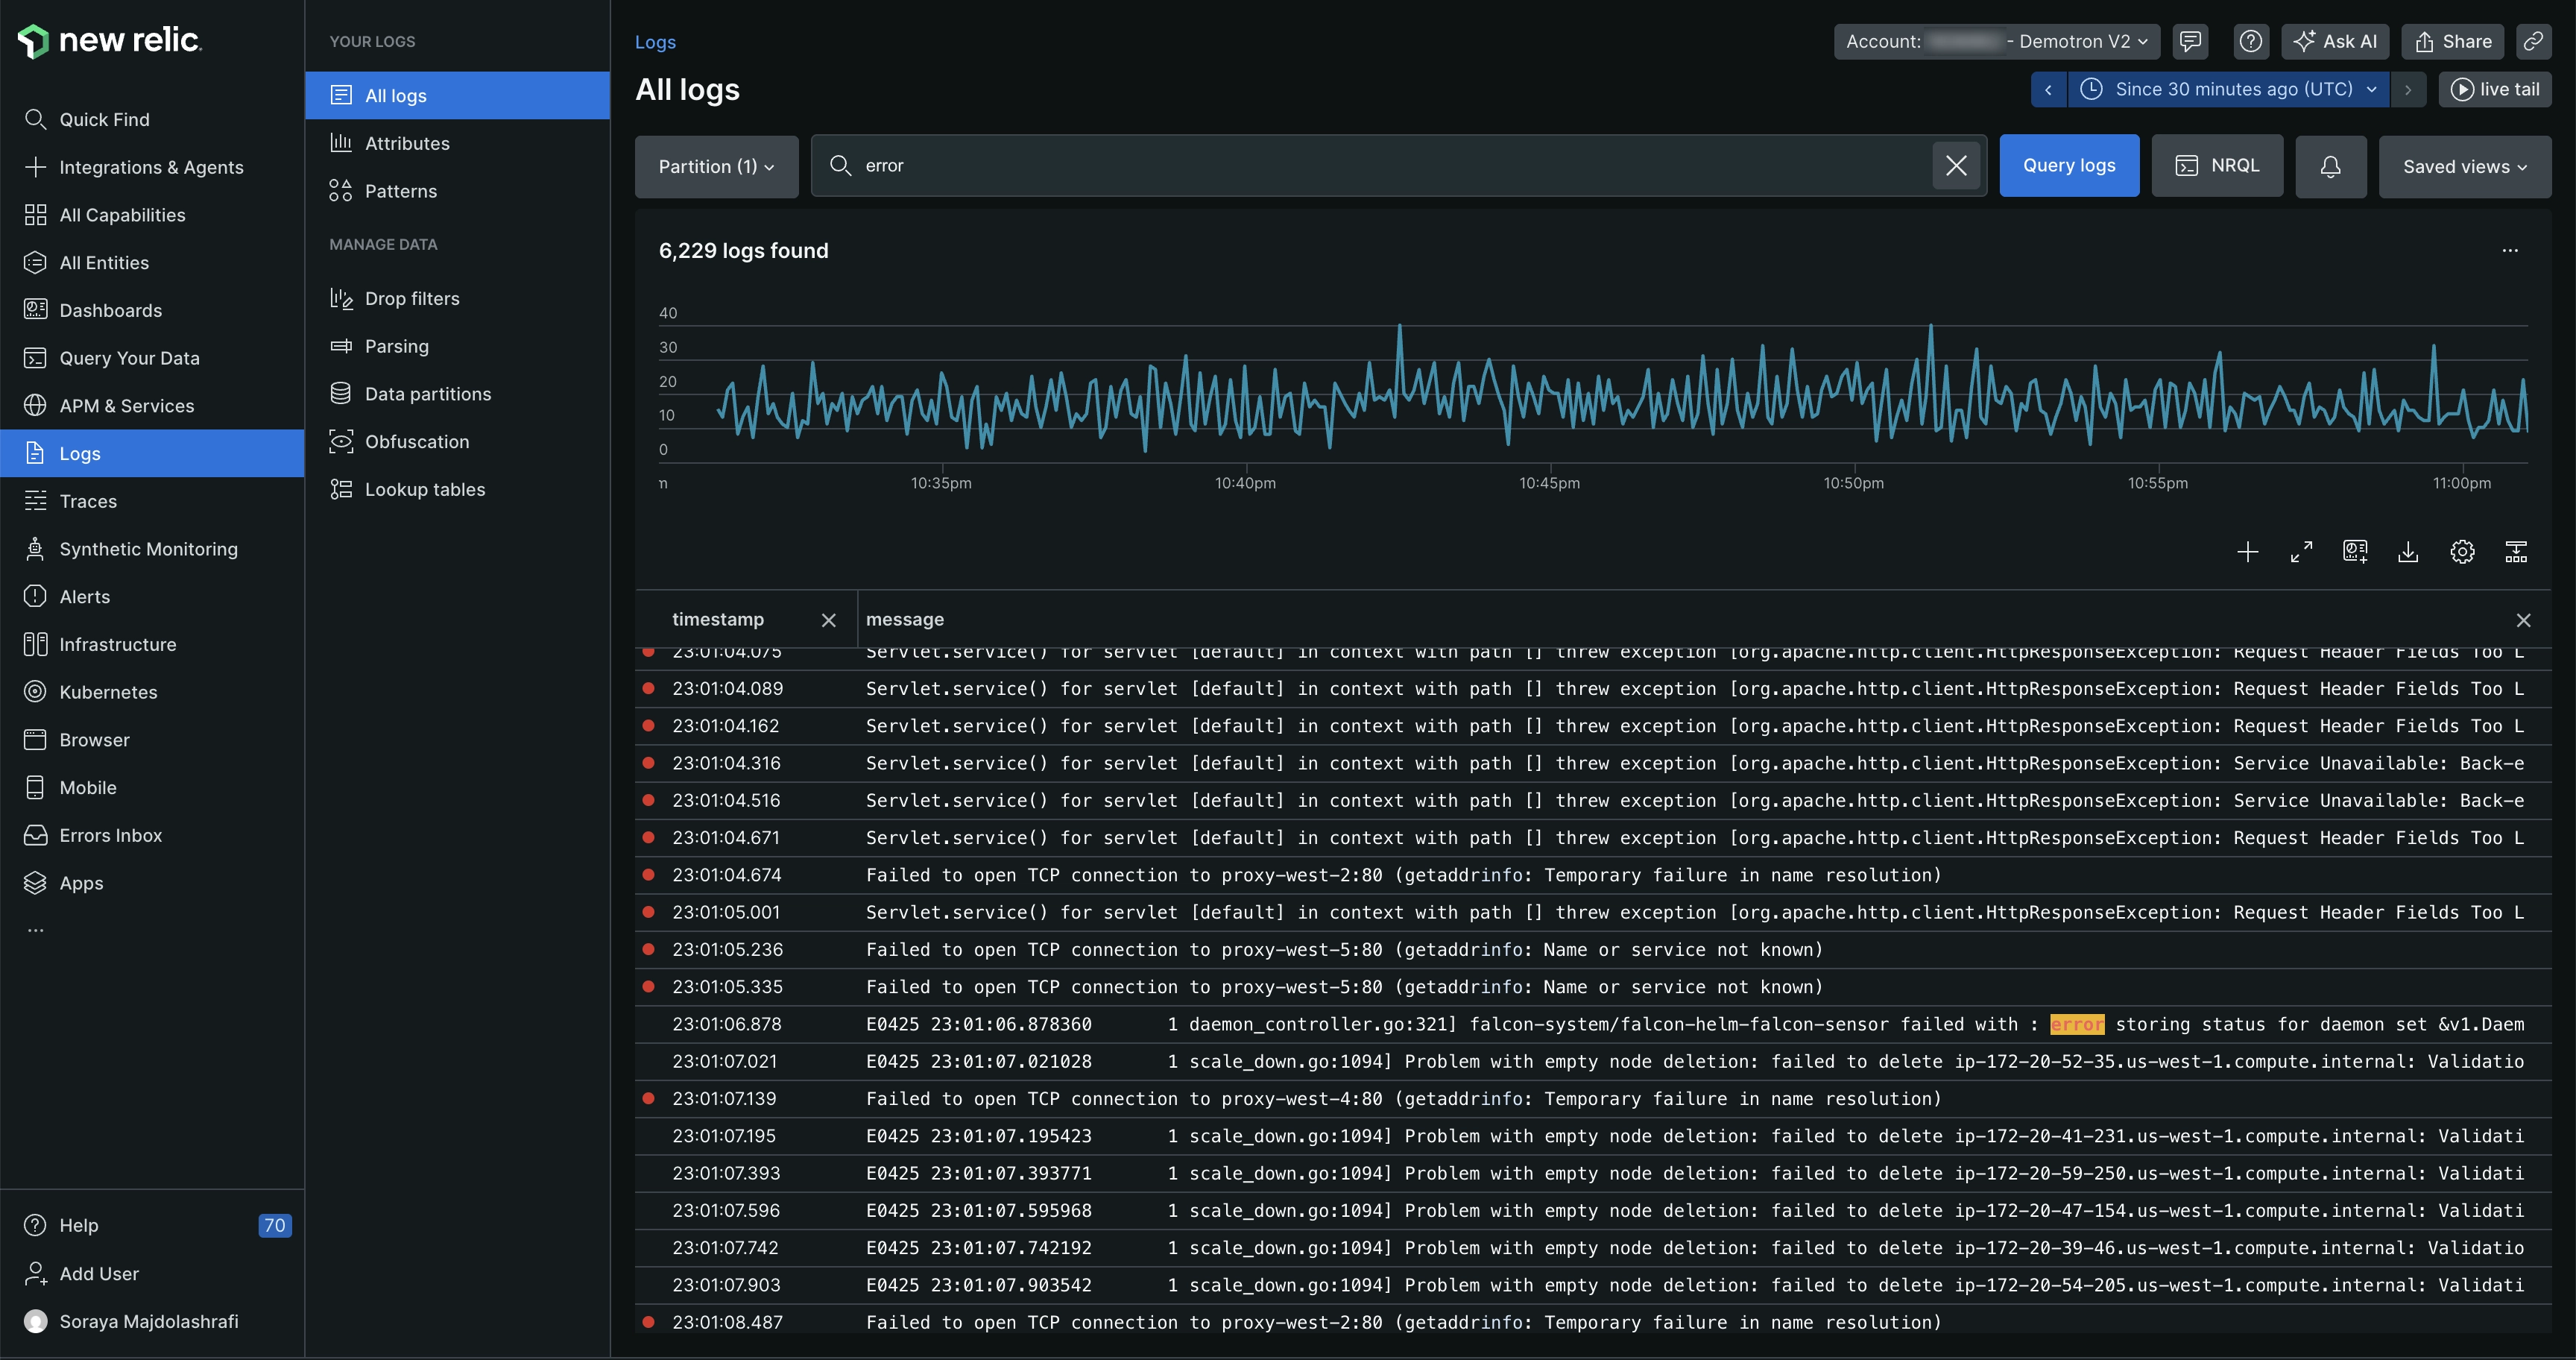
Overview: New Relic (founded 2008) started as a pioneer in SaaS APM and has since evolved into a full-stack observability platform. It offers deep monitoring of applications and infrastructure, with a unified UI called New Relic One. New Relic provides robust application performance insights - down to slow code segments and SQL queries - and correlates them with infrastructure metrics, logs, and user experience data. In recent years New Relic has doubled down on AI-driven features for proactive detection of anomalies and assisted root cause analysis.
Key Capabilities:
- Deep APM Diagnostics: Rich agents for many languages (Java, .NET, Python, Node, etc.) that instrument code to capture detailed transaction traces, database calls, external service calls, and custom spans. Developers get method-level performance visibility and distributed tracing across services.
- Full-Stack Monitoring: Besides APM, New Relic monitors infrastructure (host and container metrics), cloud services, serverless functions, mobile apps, and more. It also includes browser monitoring and synthetic checks, providing an end-to-end view from frontend to backend.
- Unified Telemetry & NRQL: All telemetry is unified in New Relic’s Telemetry Data Platform, which you can query with NRQL (New Relic Query Language) – a SQL-like query language. This allows custom charts and alerts across any combination of metrics, logs, trace/span data, etc.
- Applied Intelligence (AI/Ops): New Relic's AI features automatically detect anomalies in metrics, forecast trends, and perform root-cause analysis by analyzing dependencies. Alerts can be noise-reduced via ML. There's also a conversational interface ("New Relic AI") that can answer questions about your telemetry (e.g. summarizing a spike).
- OpenTelemetry and Open Integrations: New Relic actively supports OpenTelemetry - you can send OTLP data directly instead of using New Relic's agents. It also embraces open standards for metrics (Prometheus remote write) and logs, making it flexible in heterogeneous environments.
Pros:
- Strong APM Heritage: New Relic’s APM is battle-tested and feature-rich. It’s excellent for analyzing application performance issues – for example, slow transaction traces are tied to specific lines of code or SQL statements, which is invaluable for developers optimizing code.
- True Full-Stack Visibility: One of the few platforms where front-end user experience monitoring (RUM & mobile), synthetics, back-end APM, infrastructure, and logs all live together. This full-stack context helps correlate, say, a backend error to how many users saw broken pages.
- Improved Pricing Model: New Relic moved to a relatively simpler usage-based pricing: you pay based on data ingested and number of user seats (users can be free or paid tier). This can be cost-effective in many cases and encourages teams to instrument broadly without per-host or per-app fees.
- Innovation in AI/Ops: The platform is adding modern features like GPT-powered assistants and anomaly detection that proactively surface issues. For teams with limited time to dig through dashboards, these AI insights can highlight problems early.
Cons:
- User Seat Licensing: Charging by user (for full platform access) means some organizations might restrict who gets a login to New Relic to save cost. This collaboration tax can be counterproductive if not managed - you want engineers to freely use the observability tool. Ensure the pricing tier you choose allows enough user seats for broad access.
- NRQL Learning Curve: While powerful, NRQL is its own query language. New users must learn its syntax to unlock advanced analysis. It's not as universally known as SQL or PromQL, which could slow down initial adoption.
- Legacy and UI Complexity: New Relic has been integrating many products (APM, Infrastructure, Logs, etc.) into one interface. Some users find the New Relic One UI a bit overwhelming, with a lot of navigation and configuration needed to surface the right data. Tuning alert conditions, for example, can be intricate.
- High-Volume Costs: Although simpler than Datadog, the usage pricing can still add up if you ingest huge volumes of data (particularly logs or high-cardinality metrics). You need to be mindful of which telemetry data to send (New Relic allows configuring sampling or dropping of data too).
Ideal For: Teams that need strong application-level visibility (APM) but also want to consolidate monitoring tools. It's popular with software engineering teams who debug production issues at code level, as well as SREs ensuring reliability. Also a good fit for organizations embracing OpenTelemetry, since New Relic can act as a backend for OTel data while still providing advanced features.
Questions to Ask Before Buying:
- "How will the new pricing work for us?" - Understand your telemetry ingestion patterns (GB per day of logs, number of metric time-series, etc.) and how that translates to New Relic Data credits. Also plan how many users will need full platform access and factor that in.
- "What's the plan for legacy agents vs. OpenTelemetry?" - If you already use New Relic's APM agents, ask about support and whether you should consider migrating to OpenTelemetry instrumentation long-term. Conversely, if you prefer to use OTel from day one, verify all necessary data (traces, metrics, logs) will map cleanly into New Relic's models.
- “How does New Relic assist with incident response?” – Beyond detecting issues, see what workflow tools are available. E.g. New Relic can integrate with PagerDuty or Slack – ensure you can route its insights into your incident management process. Also ask about their AI features: can it summarize incidents or suggest likely culprits automatically?
- “What support and training are included?” – If your team is new to New Relic, inquire about onboarding assistance. New Relic offers extensive docs and some guided trial demos – confirm if you’ll have access to solutions engineers or customer success resources during evaluation.
Splunk Observability Cloud
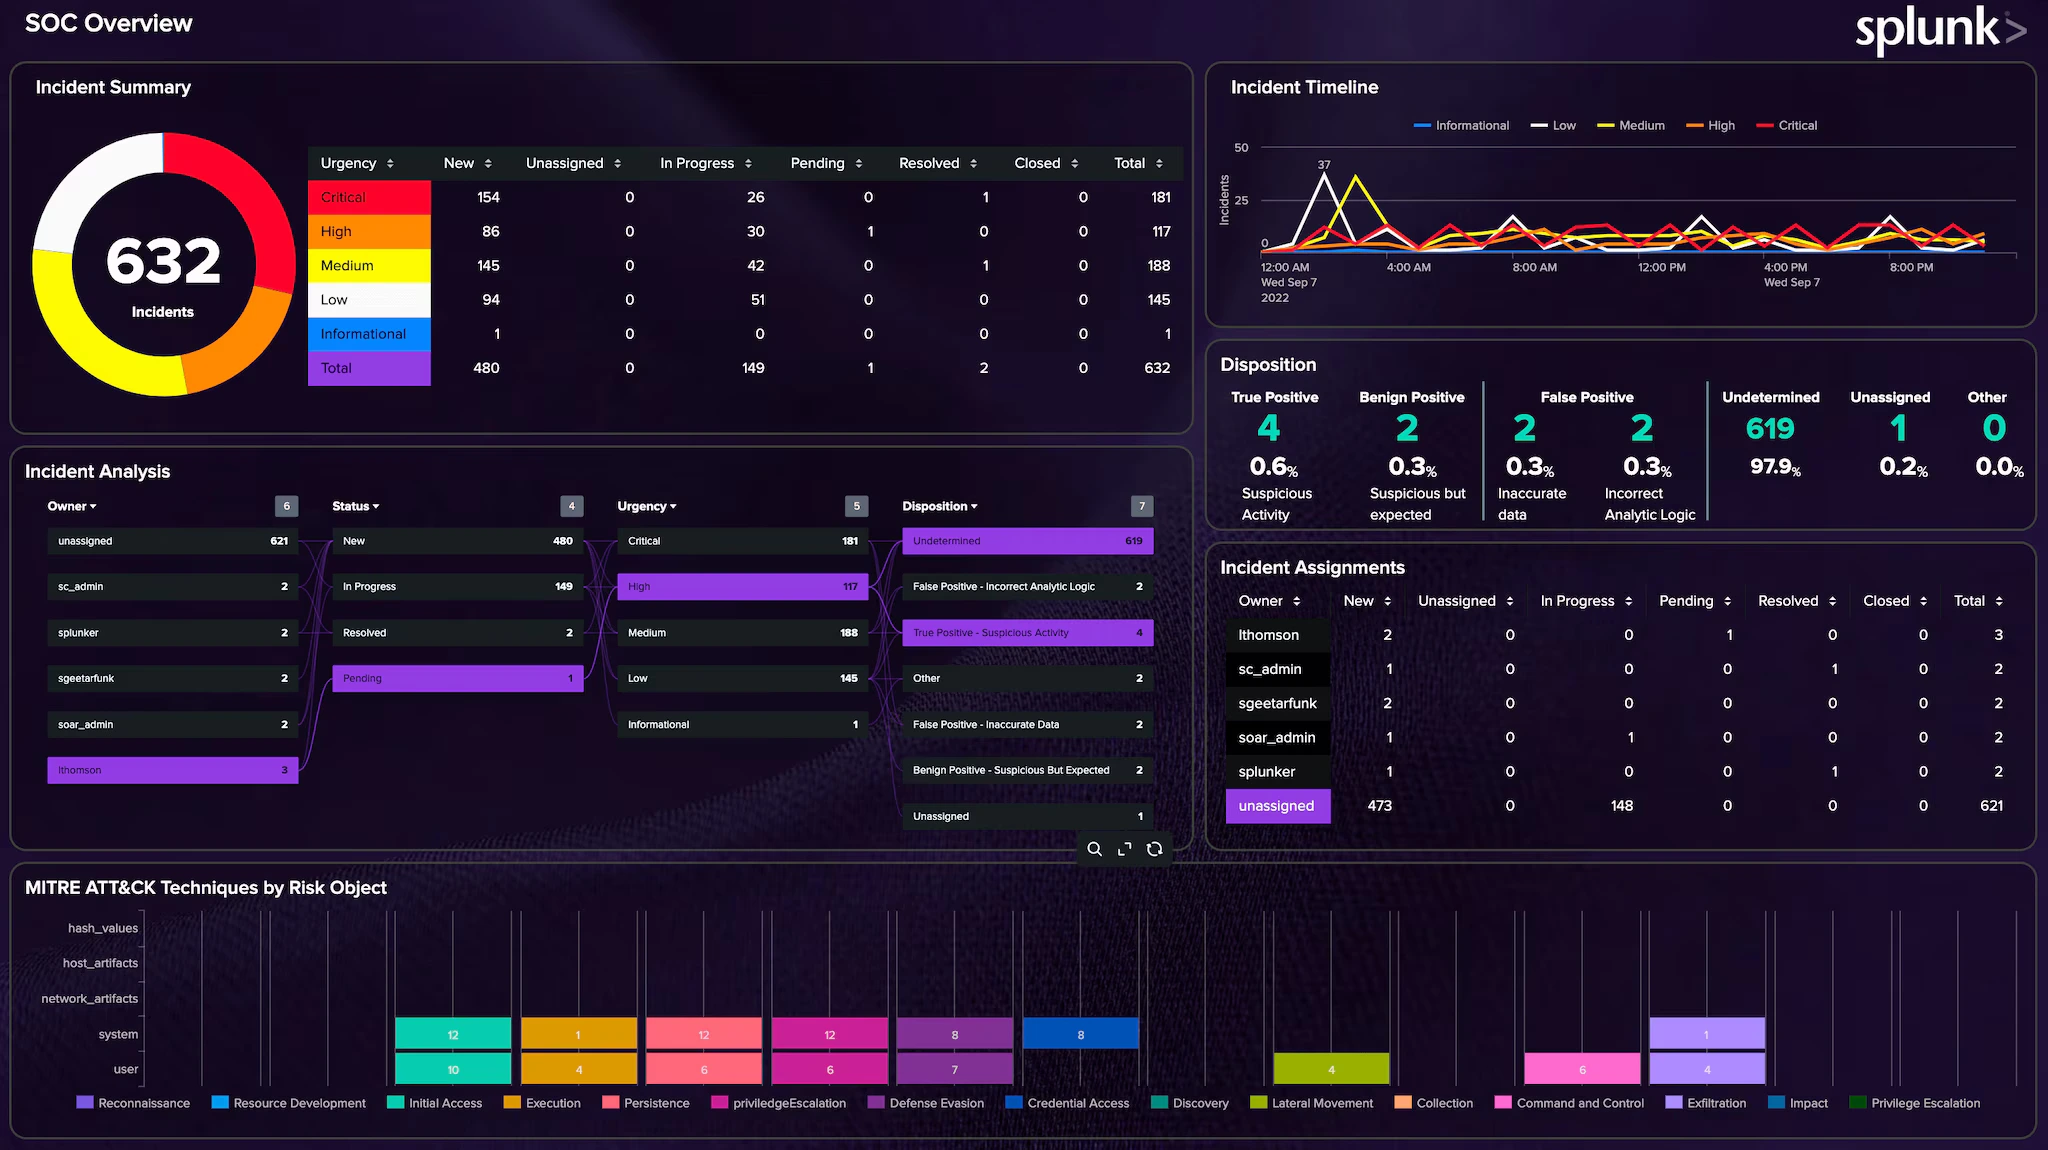
Overview: Splunk is synonymous with log management and "machine data" analytics, and Splunk Observability Cloud extends that prowess into full observability. Splunk (founded 2003) made its name with powerful log indexing and search, and in recent years it acquired SignalFx and Omnition to build out a cloud-native observability platform. The Observability Cloud (Splunk's SaaS offering) combines metrics, traces, and logs in real-time, leveraging Splunk's scalable cloud back end. Splunk's solution is especially popular in large enterprises and environments where log analysis for both IT operations and security (SIEM) is a priority.
Key Capabilities:
- Log Management Leader: At its core, Splunk provides industry-leading capabilities to ingest, index, and search logs at scale. Users can write powerful queries with the Splunk Processing Language (SPL) to sift through terabytes of logs in seconds. It's unparalleled for troubleshooting via log data and performing forensic analysis of incidents.
- No-Sample Distributed Tracing: Splunk Observability Cloud offers full-fidelity APM tracing - it doesn't sample traces by default, so every transaction can be recorded (thanks to technology from Omnition). This means you can trace outliers and low-frequency issues that sampling might miss. Service maps and span analytics help visualize and query trace data.
- Infrastructure Monitoring: Real-time streaming metrics for infrastructure (VMs, containers, K8s, cloud services). The SignalFx heritage brings a high-performance metrics datastore that can handle high-cardinality metric data with second-level resolution. You can create dashboards to monitor system metrics and custom app metrics with low latency.
- Event Correlation & AIOps: Splunk’s IT Service Intelligence (ITSI) and event correlation capabilities can be applied to observability data. It uses algorithms to detect patterns or anomalies across metrics and logs, helping reduce alert noise. For example, multiple related alerts can be grouped into one incident.
- Security Integration: A standout feature - if you also use Splunk for security (SIEM, SOAR), the Observability Cloud can feed data into those tools, and vice-versa. This creates a unified view of operational and security events. For organizations with a DevSecOps approach, Splunk provides a single ecosystem for both monitoring and threat detection.
Pros:
- Powerful Analytics at Scale: Splunk is built for big data. It excels at querying massive datasets of logs and metrics. For complex environments with tons of telemetry, Splunk's backend scales and its search language can express very advanced analyses (e.g. statistical queries over log fields).
- Full Visibility for Enterprise IT: Splunk is often used to break down silos – ops teams, dev teams, and security teams can collaborate with data on a common platform. An SRE can pull up application logs in Splunk, while a Security analyst might investigate the same data for anomalies. This cross-domain visibility is a big win for large enterprises.
- No Trade-off on Traces: With other APM tools, you sometimes sacrifice detail for cost by sampling traces. Splunk’s approach of no-sampling (or smart dynamic sampling) means if something happened, it’s likely in the data. You don’t have to wonder if a trace was dropped before you could see it. This is crucial for catching intermittent or rare issues.
- Flexible Deployment: While the Observability Cloud is SaaS, Splunk also offers on-premises solutions (Splunk Enterprise, ITSI, etc.) for those who need data on-site. There’s also a hybrid approach (Splunk Edge) if you want to forward certain data to the cloud. Splunk has a robust ecosystem of add-ons and apps as well.
Cons:
- Cost (License + Infrastructure): Splunk is one of the more expensive options. Traditional Splunk licensing is based on indexed data volume (GB per day) which can get very costly for log-heavy workloads. The Observability Cloud has its own pricing model but is still premium. Large Splunk deployments can run into millions of dollars yearly if not optimized.
- Complexity of SPL: The Splunk Search Processing Language is powerful but has a learning curve. Crafting complex queries or dashboards may require specialized knowledge. For teams without a dedicated Splunk expert, fully leveraging the tool can be challenging initially.
- Delayed Integration of Acquisitions: Splunk’s observability suite is a result of acquisitions – SignalFx for metrics, Omnition for tracing. While they are integrated, some users feel the products are not as seamlessly unified as born-in-the-cloud rivals. There may be separate components (e.g. different UIs for some functions, though it’s improving). Ensure that jumping between logs and traces in the UI is smooth for your use case.
- Cloud vs On-Prem Gap: If you’re a long-time Splunk on-premises user, note that Splunk Observability Cloud (SaaS) is somewhat separate – it doesn’t use your Splunk Enterprise license. Also, certain new features appear in the cloud product first. This is only a con for those with hybrid setups or those expecting identical capabilities in self-hosted Splunk.
Ideal For: Large enterprises and any organization where log analytics is mission-critical. Splunk is often the choice of IT operations teams managing complex, heterogeneous environments (e.g. banks, telecoms, retail with large infra footprints). It’s also ideal if you want a single vendor for both observability and security monitoring. Companies with high compliance requirements often trust Splunk due to its long track record in the field.
Questions to Ask Before Buying:
- “How much data do we plan to ingest, and what will it cost?” – Have a clear picture of your log volumes (in GB/day) and metric counts. Get a detailed quote from Splunk and inquire about ingest tiers or EPS (events per second) rates if relevant. Also ask about archiving older data to cheaper storage to control costs.
- “What is the retention and search performance for our data?” – Splunk often is configured with hot, warm, cold tiers for data. For Observability Cloud, ask how long metrics are kept at full resolution and how long logs are retained, and what happens when data ages out (can you export to S3?). Ensure the default retention meets your compliance needs.
- “Do we have the in-house expertise to manage Splunk effectively?” – If not, consider Splunk’s support offerings or hiring/training a Splunk administrator. Ask Splunk about customer success programs to help optimize your deployment.
- “How does Splunk integrate with our existing tools?” – If you use ServiceNow, Jira, PagerDuty, etc., check for integrations. Splunk has a lot of them, including the ability to push alerts and even create tickets. Verify that your operations workflow can include Splunk data (e.g. can developers easily pull Splunk logs during an incident?). Additionally, if you already have Splunk Enterprise (for logs) and are adding Observability Cloud, ask about unified user experience or data sharing between them
Dynatrace
.webp)
Overview: Dynatrace (founded 2005) is an observability platform known for its autonomous monitoring approach and enterprise focus. It's recognized for the OneAgent - a single agent that automatically instruments an entire host (covering processes, runtime, logs, etc.) - and its AI engine Davis, which continuously analyzes dependencies and anomalies. Dynatrace provides full-stack monitoring: infrastructure, APM, logs, user experience, and even application security, all tied together by AI-driven analytics. It's often favored by large organizations that require monitoring of complex, hybrid environments with minimal manual effort.
Key Capabilities:
- Automatic Full-Stack Instrumentation: Deploying the OneAgent on a host auto-discovers all running processes, containers, and services. It injects instrumentation without manual code changes, capturing metrics, traces, and logs. This drastically reduces setup time – in minutes you get a topology map of your environment.
- Davis AI Engine: Dynatrace continuously baselines metrics and traces. When problems occur, the Davis AI attempts to pinpoint the root cause by analyzing the topology and service dependencies. It can identify, for example, that a slowdown in Service A is caused by an increased error rate in Service B's database calls. The AI also performs anomaly detection and predictive alerting (forecasting capacity issues, etc.).
- Infrastructure & Cloud Monitoring: Deep integration with platforms like Kubernetes (Dynatrace automatically maps out clusters, pods, nodes), and cloud infrastructure (AWS, Azure, GCP). It monitors host health, network connectivity, and even cloud services like DynamoDB, etc., with curated dashboards.
- Digital Experience Monitoring: Dynatrace includes Real User Monitoring (via JS injection or mobile SDK) to capture front-end performance and user sessions. Synthetics are also provided (scripted test of transactions). All user actions are correlated with back-end traces for end-to-end visibility.
- Application Security Monitoring: A newer addition – Dynatrace OneAgent can also detect code-level vulnerabilities (like a library with a known flaw) and monitor runtime attacks. This ties into its observability data, giving context like “this vulnerable method was just called in a transaction.” It’s part of a trend of blending observability with security.
Pros:
- Hands-Off Configuration: Teams often praise how quickly Dynatrace starts delivering value with minimal configuration. No need to manually set up most monitors or dashboards – the platform auto-generates a dependency map and begins analysis. This is great for organizations without resources to maintain extensive monitoring configs.
- Smart Root Cause Analysis: When Dynatrace flags a problem, it usually provides a story of what happened (e.g. "Service X latency is high because Service Y is failing due to database Z connection timeout"). This accelerates troubleshooting significantly - you get not just an alert, but the likely cause, saving war-room time.
- Enterprise-Grade Features: Dynatrace offers strong RBAC for multi-team environments, data governance features, and can scale to tens of thousands of hosts. It also has on-premises deployment (Managed edition) for those who cannot use SaaS. Many large enterprises (banks, airlines, etc.) use it for its reliability and support.
- Continuous Performance Optimization: Because it keeps all traces (with adjustable retention) and can baseline normal performance, Dynatrace can spot regressions after a deployment or even suggest where code might be inefficient. It’s like an expert eye on your system 24/7, which is useful for continuous improvement.
Cons:
- Opaque "Magic" and Tuning: The flip side of automatic and AI-driven monitoring is that it can feel like a black box. Some teams prefer more control or understanding of how an alert was triggered. If the AI is wrong or too noisy, tuning it can be non-trivial. You might have to adjust detection sensitivity or provide feedback to the model, which requires learning Dynatrace's ways.
- Proprietary Technology: Dynatrace’s instrumentation and data aren’t based on open standard formats by default (though it does ingest OpenTelemetry to an extent). If you rely on the OneAgent, you’re tied into Dynatrace’s ecosystem. Switching to another solution down the line might mean re-instrumenting with new agents.
- Cost and Licensing: Dynatrace is positioned at the premium end of the market. It’s often sold on a per-host unit basis (with different weighting for host sizes or per 1000 Davis events, etc., depending on license model). It can be expensive for large environments, especially if you want to monitor everything (which Dynatrace encourages). ROI is high if you utilize the automation fully, but cost can be a barrier for smaller companies.
- Overkill for Small/Mid Teams: For a 5-service startup, deploying something as heavy-duty as Dynatrace may be unnecessary. The product shines in complexity, but if your architecture is simple, a lighter-weight tool (or open-source stack) might be sufficient and more cost-effective.
Ideal For: Medium to large enterprises with complex microservice architectures, especially those spanning hybrid environments (cloud + on-prem). Dynatrace works well for organizations that want an auto-pilot observability solution – minimal manual instrumentation, with AI surfacing issues – and have the budget to invest in a top-tier tool. It’s commonly used in finance, retail, telecom, and other industries where performance issues directly impact revenue and need swift resolution.
Questions to Ask Before Buying:
- “What licensing model and capacity do we need?” – Dynatrace offers different editions and add-ons (infrastructure-only, full-stack, etc.). Understand how your environment translates to their licensing units. Ask for a sizing exercise: e.g., X hosts, Y million unique metrics, Z traces/day – what’s optimal? Ensure to include not just today’s footprint but growth projections.
- “How do we handle OpenTelemetry or existing instruments?” – If you already have apps instrumented with OpenTelemetry, discuss with Dynatrace how that data can be ingested (Dynatrace supports an OTel collector input). Also, if you plan to instrument any services manually or use third-party data (like Prometheus metrics), confirm those integration paths.
- “What are the on-premises requirements (if not SaaS)?” – If you opt for Dynatrace Managed (self-managed cluster), ask about the hardware and ops overhead. Running the cluster that processes all the data can require significant resources. If SaaS, ask about data residency (where is data hosted?) and compliance (is the SaaS FedRAMP certified if you need that, etc.).
- “How does the AI handle noisy neighbors and false positives?” – In complex systems, sometimes multiple issues happen at once. Ask how Dynatrace’s AI distinguishes root causes from symptoms. Also inquire about the tuning process: can your team easily adjust alert thresholds or teach the AI about planned changes (so it doesn’t alert)? This will give insight into ongoing maintenance effort.
Grafana & Prometheus (Open Source Stack)
.webp)
Overview: Grafana and Prometheus represent the quintessential open-source observability stack for cloud-native teams. Prometheus (CNCF project, born at SoundCloud in 2012) is a metrics collection and alerting system, while Grafana (launched 2014) is the leading visualization tool for time-series data. Together, they form the backbone of many Kubernetes monitoring setups. Typically, Prometheus scrapes metrics from applications and infrastructure (often via exporters), and Grafana displays those metrics on dashboards. Over time, this OSS stack has expanded: Loki for log aggregation and Tempo for distributed tracing can integrate to provide a more complete open-source observability solution (sometimes called the "PLG" or "LGTM" stack: Loki-Grafana-Tempo-Mimir, etc.). Grafana Labs also offers Grafana Cloud, a hosted version of this stack for those who want the benefits without self-managing.
Key Capabilities:
- Prometheus Metrics & Alerting: Prometheus collects numeric time-series metrics (e.g. CPU usage, request rates) and stores them efficiently. It has a powerful query language, PromQL, to aggregate and analyze metrics. Prometheus also includes Alertmanager to trigger alerts based on query results (like high error rate). It’s pull-based (scraping endpoints) and well-suited for dynamic environments with service discovery (like K8s).
- Grafana Dashboards: Grafana provides interactive dashboards where you can graph metrics, visualize logs, and more. It supports not just Prometheus but dozens of data sources (Elasticsearch, InfluxDB, CloudWatch, etc.), making it a versatile front-end. Grafana dashboards are highly customizable and shareable, with features like variables, ad-hoc queries, and drilling down on data points.
- Loki for Logs: Loki (by Grafana Labs) is a log aggregation system inspired by Prometheus – it’s multi-tenant and indices logs by labels (like app, cluster, etc.) instead of full text, making it more cost-efficient at scale. Grafana can query Loki with LogQL (similar syntax to PromQL) to show logs alongside metrics.
- Tempo for Traces: Tempo is a distributed tracing backend (also by Grafana Labs) that stores trace data (from Jaeger, OpenTelemetry, etc.) cost-effectively by indexing only trace IDs (and storing the rest in object storage). In Grafana, you can integrate Tempo to view traces (e.g., jump from a spike in a metric to traces of requests in that time).
- Flexibility & Extensibility: Being open-source, you can extend the stack with plugins and integrate it into CI/CD pipelines, infrastructure-as-code, etc. Grafana’s plugin ecosystem provides integrations for many technologies and themed dashboards. You have full control over configurations, retention policies, and can contribute back to the community.
Pros:
- No Vendor Lock-in: Everything is open-source. You own your data and the stack can be run anywhere. If you decide to switch or modify components, you can – your instrumentation can be reused (especially if using open standards like Prometheus exporters or OTel SDKs). This is future-proofing for many teams concerned about proprietary lock-in.
- Best-in-Class Visualization: Grafana is widely regarded as one of the best dashboard tools. The visuals are clean and it supports advanced queries and transformations. It’s the go-to for many because of how easily you can create tailored monitoring views. The Grafana community has thousands of pre-built dashboards you can import for common applications.
- Strong for Kubernetes & Microservices: Prometheus is designed with modern cloud environments in mind – it can handle ephemeral pods and dynamic scaling via service discovery. It’s very efficient at high-cardinality metrics (with proper tuning) and has become a standard in Kubernetes monitoring. Many cloud-native applications expose Prometheus-format metrics out-of-the-box.
- Cost Efficiency (Self-Managed): You avoid recurring license fees by using open source. If you have the skills to manage it, running your own Prometheus and Grafana can be cheaper, especially at scale, than paying a vendor per GB or host. You can also fine-tune retention and data rollups to balance cost and needs.
Cons:
- Not a Unified Platform: The open-source stack is essentially a collection of separate components (metrics, logs, traces each handled by different systems). Unlike a single-vendor solution, you might lack unified correlation out-of-the-box. For example, linking a log to a metric requires some custom setup (like injecting trace IDs). There's no single query that natively joins metrics, logs, and traces - you rely on Grafana's UI to context switch between them.
- Operational Overhead: Running Prometheus, Grafana, Loki, Tempo (and possibly multiple instances for scale or HA) is non-trivial. Prometheus alone might need a separate long-term storage solution (like Thanos or Cortex) if you have large retention needs. Loki and Tempo require managing storage backends. This "DIY observability" can consume significant engineering time to install, scale, and maintain - effectively becoming its own internal service. Smaller teams might struggle with this overhead.
- Scaling Challenges: Prometheus server has limits (single-node ingestion rate, memory for index, etc.). Very large environments often need sharding or federation which adds complexity. Loki and Tempo, while more scalable by design, are still relatively newer and might need tuning for heavy loads. Essentially, you assume responsibility for ensuring the stack scales – whereas with a SaaS vendor that’s their problem.
- Feature Gaps: The OSS stack may lack some advanced features that commercial tools have out-of-the-box, such as AI-driven anomaly detection, sophisticated access controls/multi-tenancy (unless you layer something like Grafana Enterprise), or a built-in user experience monitoring component. You may need to integrate additional tools (e.g., Jaeger UI for more advanced trace analysis, or use external AI tools) to match all capabilities of a full observability solution.
Ideal For: Organizations that value open-source flexibility and have the engineering capability to manage it. It’s very popular with platform teams running Kubernetes, as well as startups who want to avoid high monitoring bills by leveraging free tooling (at least until they scale up). Also a great choice if you need on-premises monitoring with no external dependencies (e.g., air-gapped environments). Many companies start with Grafana/Prometheus and later consider managed services or vendors once they hit scaling pain points or want more features.
Questions to Ask Before Expanding/Choosing:
- “Do we want to self-host or use a managed service?” – Grafana Labs offers Grafana Cloud (with hosted Prometheus/Loki/Tempo). If your team is small or you prefer not to maintain the stack, compare the cost of managed service vs. the effort of self-hosting. You might start self-hosted and then outgrow it.
- “How will we handle long-term storage and high availability?” – If you need to retain metrics for many months or have 24/7 uptime requirements, plan this upfront. Consider technologies like Thanos or Cortex for Prometheus HA/long retention. For logs, consider Loki clustering or an alternative like Elastic if needed. These choices significantly affect complexity.
- “What’s our strategy for log and trace correlation?” – Determine how you’ll link logs and traces with metrics. This could involve adopting consistent labels (e.g., embed trace IDs in logs). Grafana can then help jump between data, but you need to instrument your apps appropriately (like using OpenTelemetry SDKs that auto-inject IDs).
- “Do we have the in-house expertise?” – Running this stack requires familiarity with YAML configs, Linux ops, maybe Kubernetes (if you deploy it there), etc. If you don’t have someone who enjoys tinkering with infrastructure, you might struggle. It’s worth possibly training team members or hiring a specialist. Alternatively, opt for Grafana Cloud or another hosted Prometheus service to reduce the learning curve.
Elastic Observability (ELK Stack)
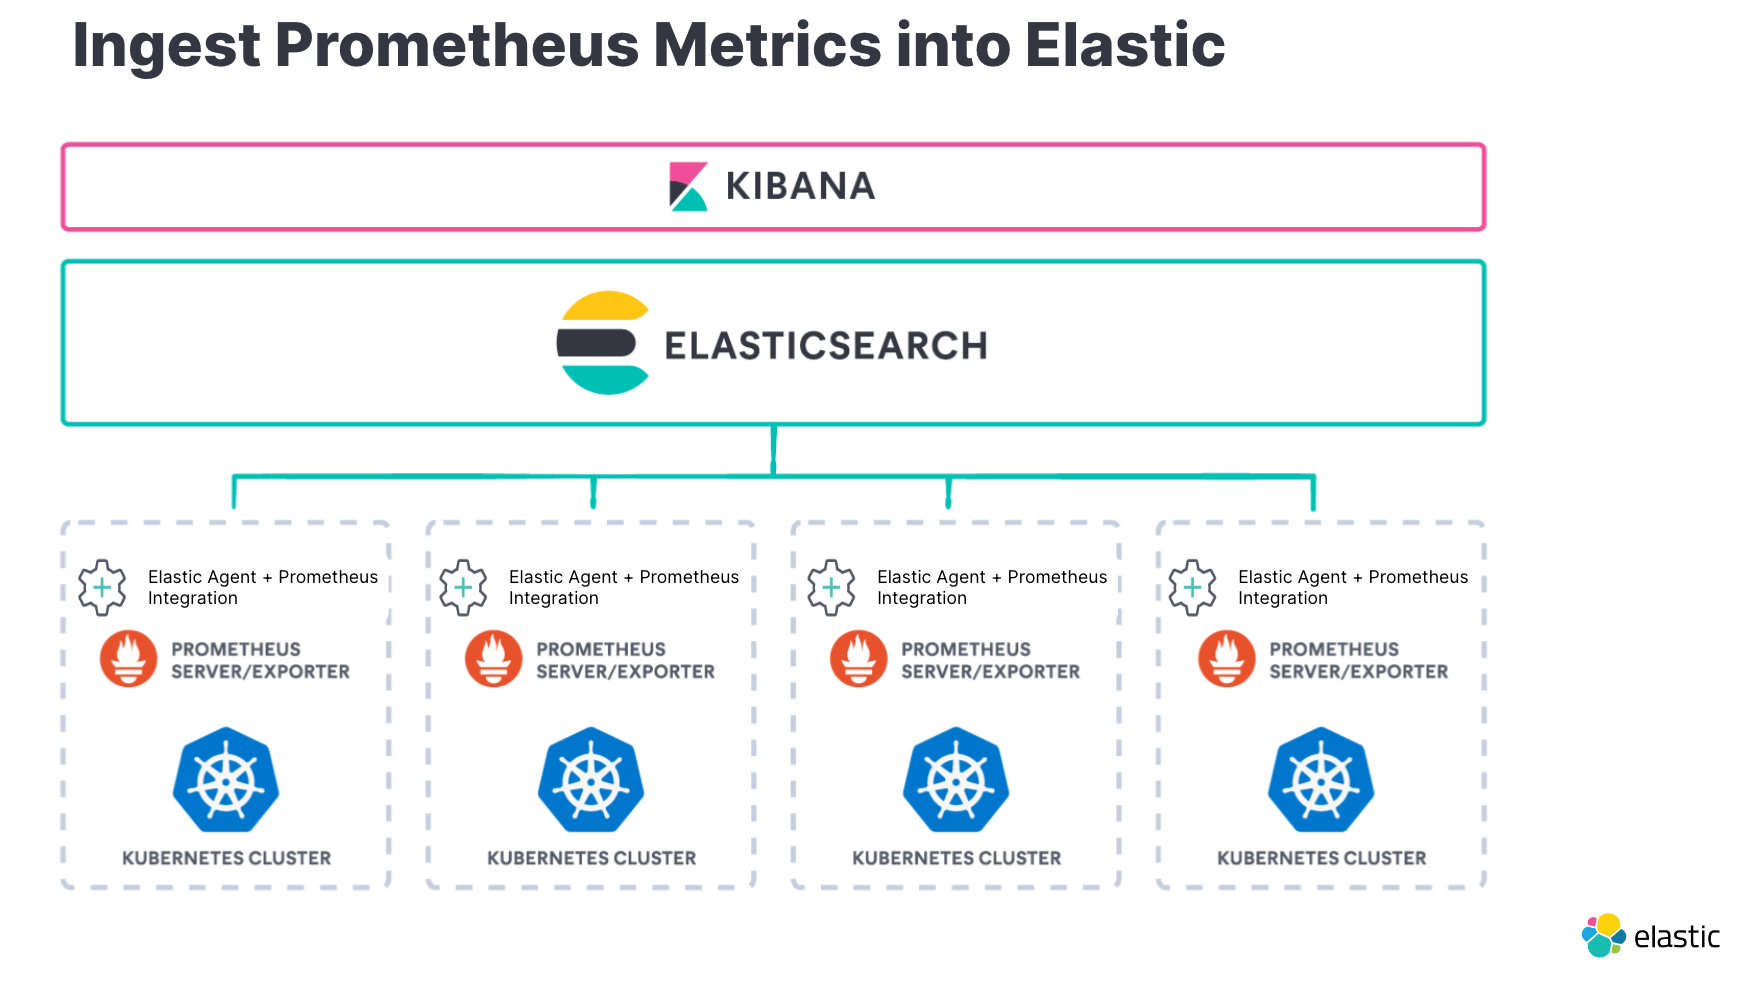
Overview: Elastic Observability builds on the popular ELK stack (Elasticsearch, Logstash, Kibana) that many teams have used for log management. Elastic.co has integrated metrics and APM capabilities into this stack, turning it into a more complete observability solution. With Elastic Observability, you can ingest logs, metrics, and application traces, and analyze them using the powerful search and visualization features of Kibana. It's available as both open-source/self-managed (with basic features) or with additional features on Elastic's paid license and cloud service. One advantage is that organizations already using Elasticsearch for logs or search can extend it to observability without introducing a completely new platform.
Key Capabilities:
- Log Aggregation and Search: At its core, Elastic is a search engine. It can ingest huge volumes of log data via Beats or Logstash and index them in Elasticsearch. Kibana then allows fast full-text search, filtering, and creating visualizations from logs (like frequency of an error, top 5 URLs causing 500s, etc.). The schema is flexible (Elasticsearch JSON documents), supporting various log formats.
- Metrics Monitoring: Elastic’s Beats (like Metricbeat) and the newer Elastic Agent collect system and application metrics. These metrics are stored in Elasticsearch as time-series data. Kibana has UIs (Infrastructure UI, etc.) for exploring hosts, k8s pods, etc., showing metric charts. Elastic can perform aggregations and even machine learning on time-series (e.g. forecast, anomaly detection) if licensed.
- APM and Tracing: Elastic APM is an offering that includes language agents (for Java, Python, JavaScript, etc.) to collect distributed traces and application performance metrics (response times, throughput, errors). The APM data is stored in Elasticsearch. Kibana's APM UI then visualizes transactions, spans, and provides a service map. It can track things like slow queries, exceptions, and trace sampling can be adjusted.
- Unified Analysis in Kibana: Kibana acts as the single pane for all data – you can create dashboards that might include a panel of log events, a panel of a metric timeline, and a panel of APM latency, all correlated by time. It also has features like Lens (an easy drag-and-drop interface for ad-hoc analysis) and Canvas (for custom infographic-like dashboards).
- Elastic Security and Observability Together: Elastic also offers SIEM and endpoint security on the same stack. This means if you use Elastic for both security event management and observability, you can query across data sets. For example, during an incident, you could search logs and security alerts in one place. Elastic’s machine learning features can also be used to detect anomalies in any of the ingested data.
Pros:
- Strong Log Management: Elastic’s origins as a log/search solution mean it’s very capable for log-heavy observability needs. Complex search queries, free text, statistical analyses on log fields – all possible with the Elastic query DSL or Kibana UI. If logs are your primary concern (e.g., troubleshooting application errors, auditing user actions), Elastic is a great fit.
- One Stack for Multiple Uses: Many organizations already use Elasticsearch for other purposes (search on their website, analytics, SIEM, etc.). Extending it to observability leverages existing investment and expertise. It can reduce the number of different platforms in play.
- Flexibility and Control: Being self-manageable and partially open source, Elastic allows a lot of customization. You can define index lifecycle policies (e.g., delete or snapshot indices older than 30 days), choose your hardware or cloud infrastructure, and decide which data to index at high resolution. Plus, if needed, you can directly query the data via APIs – it’s your Elasticsearch cluster.
- Scalability (with Effort): Elasticsearch can scale to handle very large data volumes by adding nodes to the cluster. It’s battle-tested in big deployments indexing terabytes of data per day (though it requires careful configuration). The ability to horizontally scale by sharding data is a big plus for long-term growth.
Cons:
- Operational Burden and Tuning: Running Elastic at scale is non-trivial. Operating a large Elasticsearch cluster requires tuning (heap sizes, shard counts, indexing rates, etc.) and careful monitoring (to prevent node failures, split brain scenarios, etc.). If you ingest a lot of data, you may spend significant time managing cluster performance. Many teams have been bitten by issues like indexing backlogs or cluster instability when operating at the edge of capacity.
- Not Natively OpenTelemetry: Elastic APM was developed separately from the OpenTelemetry standard, so while it can receive OTel data (via an OpenTelemetry Collector using the Elastic output), the data is transformed into Elastic’s schemadash0.com. If you’ve heavily invested in OTel, you might need to adjust how data maps into Elastic (or run OTel Collector -> Elastic APM Server). It’s not as plug-and-play for OTel as some newer platforms.
- Query Complexity and Learning Curve: Kibana is powerful but can be complex. Users need to learn the Kibana interface and possibly the Query DSL for advanced searches. Also, building dashboards that join data (like logs and metrics) isn’t as straightforward as some unified platforms. You might have to use multiple tools (Discover for logs, Visualize for metrics, APM UI for traces) rather than a single cohesive workflow.
- License and Features: The basic features are open, but some useful capabilities (advanced security, machine learning anomaly detection, searchable snapshots for long-term storage, etc.) require a paid license or Elastic Cloud subscription. Elastic underwent license changes (to SSPL) for newer versions, which some open-source purists didn’t like (resulting in forks like OpenSearch). If these aspects matter to you, you’ll need to navigate licensing choices.
Ideal For: Teams that have a strong logging focus or who are already comfortable with the ELK stack. It’s common in companies that started with ELK for logs and want to avoid sending that data to another tool for observability. Also good for organizations that prefer self-managed solutions but want a more integrated approach than disparate OSS tools – Elastic gives an integrated feel for logs, metrics, traces within Kibana. Use cases span from application troubleshooting, infrastructure monitoring, to even IoT analytics – Elastic is quite flexible.
Questions to Ask Before Buying/Adopting:
- “Cloud or self-hosted Elastic – which makes sense?” – Elastic Cloud offers a managed service which can reduce the ops burden. Compare the cost of Elastic Cloud (which is usage-based) versus the engineering effort and hardware cost of running it yourself. Sometimes Elastic Cloud ends up being efficient for moderate scales, but at very large scale, self-hosting on your own hardware could be cheaper (but then you pay in manpower).
- “How will we design our data schema and retention?” – Plan out index mappings and data lifecycle. For example, decide on how you’ll index logs (which fields to make searchable), how long to keep full-resolution metrics, whether to use rollups for older data, etc. These decisions impact performance and cost. It might be worth consulting Elastic experts or solution architects on best practices for your use case.
- “Do we need features that require the paid license?” – If you need machine learning anomaly detection, or alerting (basic alerting is now free in 7.x, but some features were paid), or security features, price that in. Elastic’s licensing can be module-based, so ensure you know what’s included in the free tier versus what isn’t. Also check if the open-source fork (OpenSearch) is an alternative you consider, although it won’t have the official Elastic APM.
- “What’s our plan for scaling and high availability?” – Ask how to architect for HA (at least three master nodes, etc.) and how you’ll add capacity as data grows. It’s good to pilot the observability solution on Elastic with a subset of data to gauge performance, then scale up. Consider if you’ll need multiple clusters (one for logs, one for APM perhaps) or if a single cluster can handle it. Knowing Elastic’s limits for your workload type is key to a smooth deployment.
Middleware
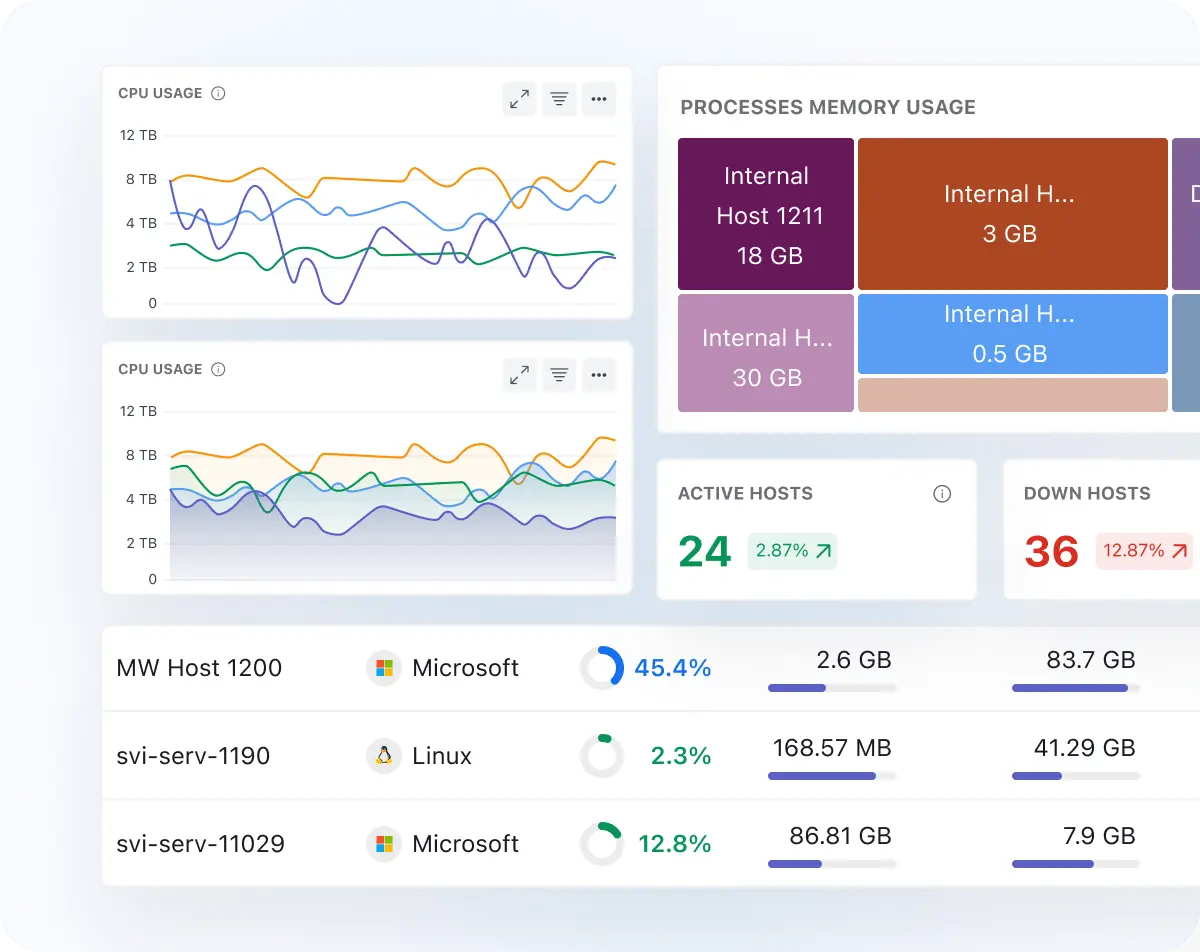
Overview: Middleware (founded 2021) is a full-stack cloud observability platform built for the modern engineering team — one that wants unified visibility without the complexity or sticker shock of legacy APM tools. Backed by Y Combinator and designed from the ground up with OpenTelemetry at its core, Middleware consolidates metrics, logs, traces, and infrastructure data into a single correlated view. Unlike older observability incumbents that bolt on features over years, Middleware was architected for cloud-native environments from day one — making it equally accessible to a five-person startup and a scaling enterprise engineering team. Its philosophy is simple: observability should be fast to set up, intuitive to use, and affordable to grow with.
Key Capabilities:
- Unified Observability (Metrics, Logs, Traces, Infrastructure): Middleware brings all four pillars of observability — metrics, logs, distributed traces, and host/container infrastructure data — into a single correlated platform. Engineers can jump from a latency spike in a trace directly to the correlated logs and infrastructure metrics in the same UI, without switching tools or mentally stitching context together. This end-to-end correlation is built-in, not patched together.
- OpenTelemetry-Native Instrumentation: Middleware is built natively on OpenTelemetry (OTel), the CNCF's open standard for telemetry collection. This means you instrument your services once using OTel SDKs (which Middleware provides lightweight wrappers around for popular languages like Python, Node.js, Go, Java, Ruby, and more) and send data to Middleware — no vendor lock-in on your instrumentation layer. For teams already on OTel, Middleware is a drop-in backend with zero re-instrumentation required.
- Real User Monitoring (RUM) & Session Replay: Beyond backend observability, Middleware extends visibility into the frontend with Real User Monitoring. You can track page load times, Core Web Vitals, JavaScript errors, and user journeys — and replay individual user sessions to reproduce hard-to-debug frontend issues. This end-to-end coverage from browser to backend is rarely found in a single affordable platform.
- AI-Powered Alerting and Root Cause Analysis: Middleware includes ML-driven anomaly detection and alert correlation that reduces alert fatigue by grouping related alerts into meaningful incidents. Rather than flooding on-call engineers with hundreds of individual alerts, the platform surfaces the probable root cause with correlated signals, helping teams resolve incidents faster. Users can also set up custom alert policies with fine-grained conditions across any telemetry type.
- Infrastructure Monitoring with Auto-Discovery: Middleware's agent auto-discovers hosts, Kubernetes clusters, containers, and cloud services (AWS, GCP, Azure), collecting infrastructure metrics out of the box with minimal configuration. Kubernetes-native users get pre-built dashboards for pods, nodes, namespaces, and deployments, while the platform continuously maps service dependencies to keep topology views current as environments evolve.
Pros:
- Fast Time-to-Value: Middleware is known for an exceptionally quick setup experience. Teams can go from signup to full observability — traces, logs, metrics, and infra — in under an hour using the guided onboarding and auto-instrumentation agents. This stands in sharp contrast to legacy APMs that can take weeks of professional services work to fully deploy. For lean engineering teams or fast-moving startups, this matters enormously.
- Genuinely Unified Platform — No Silos: Many observability tools claim unification but are really acquired products stitched together with a shared login. Middleware was purpose-built as a single platform, so correlation between signals is native and seamless. Clicking from a failing trace to its correlated logs or the host metrics at that timestamp is instant — no context switching, no re-querying in a separate product.
- Accessible Pricing Across All Team Sizes: Middleware offers a free tier and transparent, usage-based pricing that scales predictably. Small teams get real observability capabilities without enterprise pricing barriers, while larger teams benefit from cost controls and volume discounts. This makes Middleware one of the rare platforms that genuinely serves startups through to mid-market without requiring a separate SKU or sales negotiation for every feature.
- OTel-First Architecture Reduces Lock-In Risk: Because Middleware is built on OpenTelemetry standards, your instrumentation investment is portable. If you ever decide to change backends, your OTel-instrumented services can be redirected without re-writing a line of application code. This is a meaningful advantage over proprietary-agent-first vendors, where switching costs are punishingly high.
Cons:
- Requires Thoughtful Onboarding for Complex Stacks: While Middleware's setup is fast for standard environments, organizations with deeply customized or legacy infrastructure may want to invest time upfront in mapping out their instrumentation strategy. This isn't a limitation of the platform — it's simply good practice that pays dividends in cleaner data and more actionable dashboards from day one.
- Feature Richness Can Require Exploration: Middleware packs a significant amount of capability into a single platform — unified traces, logs, metrics, RUM, session replay, and AI alerting. Teams new to full-stack observability may initially use only a subset of features before discovering the full depth. Budgeting time for team enablement ensures you're getting the full return on the platform.
- Best Value When Adopted Platform-Wide: Like any unified observability solution, Middleware delivers the most value when adopted consistently across services and teams rather than used in pockets. Organizations that consolidate onto Middleware fully — replacing fragmented point solutions — see the biggest impact in cross-signal correlation and cost efficiency.
Ideal For: Engineering teams of any size that want a modern, unified observability platform without the implementation complexity of legacy APMs or the cost unpredictability of per-host/per-metric pricing giants. Middleware is particularly well-suited for cloud-native teams building on Kubernetes, companies already adopting OpenTelemetry standards, and startups or scale-ups that need enterprise-grade observability capabilities without an enterprise budget. It's also a strong fit for organizations that want frontend-to-backend visibility in a single tool — combining RUM, APM, log management, and infrastructure monitoring under one roof.Questions to Ask Before Buying:
- "How does Middleware handle our current instrumentation — do we need to re-instrument?" — Ask Middleware to walk through your existing stack. If you're already using OTel SDKs, the answer is likely minimal effort: point your OTel exporter at Middleware's endpoint. If you're on a proprietary agent (e.g., Datadog Agent), understand the migration path — Middleware typically provides migration guides and their team can assist. Clarify whether any custom metrics or non-standard libraries require additional instrumentation work.
- "What does pricing look like as we scale, and are there any surprise cost drivers?" — Request a detailed pricing walkthrough based on your current telemetry volumes: estimated log ingestion (GB/day), number of hosts, trace volume, and active users for RUM. Ask specifically about retention costs, high-cardinality metric charges, and session replay pricing. Middleware's pricing is generally transparent, but like any observability tool, unexpected data growth can impact costs — understand the levers you have to control spend.
- "How does Middleware's AI alerting and root cause analysis work in practice?" — Ask for a live demo using a realistic incident scenario from your stack. See how the platform groups alerts, surfaces correlated signals, and presents root cause hypotheses. Ask about false positive rates in their anomaly detection, and whether alert policies can be tuned per service or environment. Good alerting is where observability tools live or die in production — evaluate this rigorously.
- "What's the roadmap for enterprise governance and compliance features?" — If your organization requires SOC 2 Type II, HIPAA, or GDPR controls, audit logging, or specific data residency requirements, ask Middleware directly for their current compliance posture and certifications. Get clarity on data retention controls, the ability to delete specific data on request, and the roadmap for any enterprise governance features that are still in development. Knowing what's available today versus planned for Q3/Q4 helps you make an informed commitment.
Honeycomb
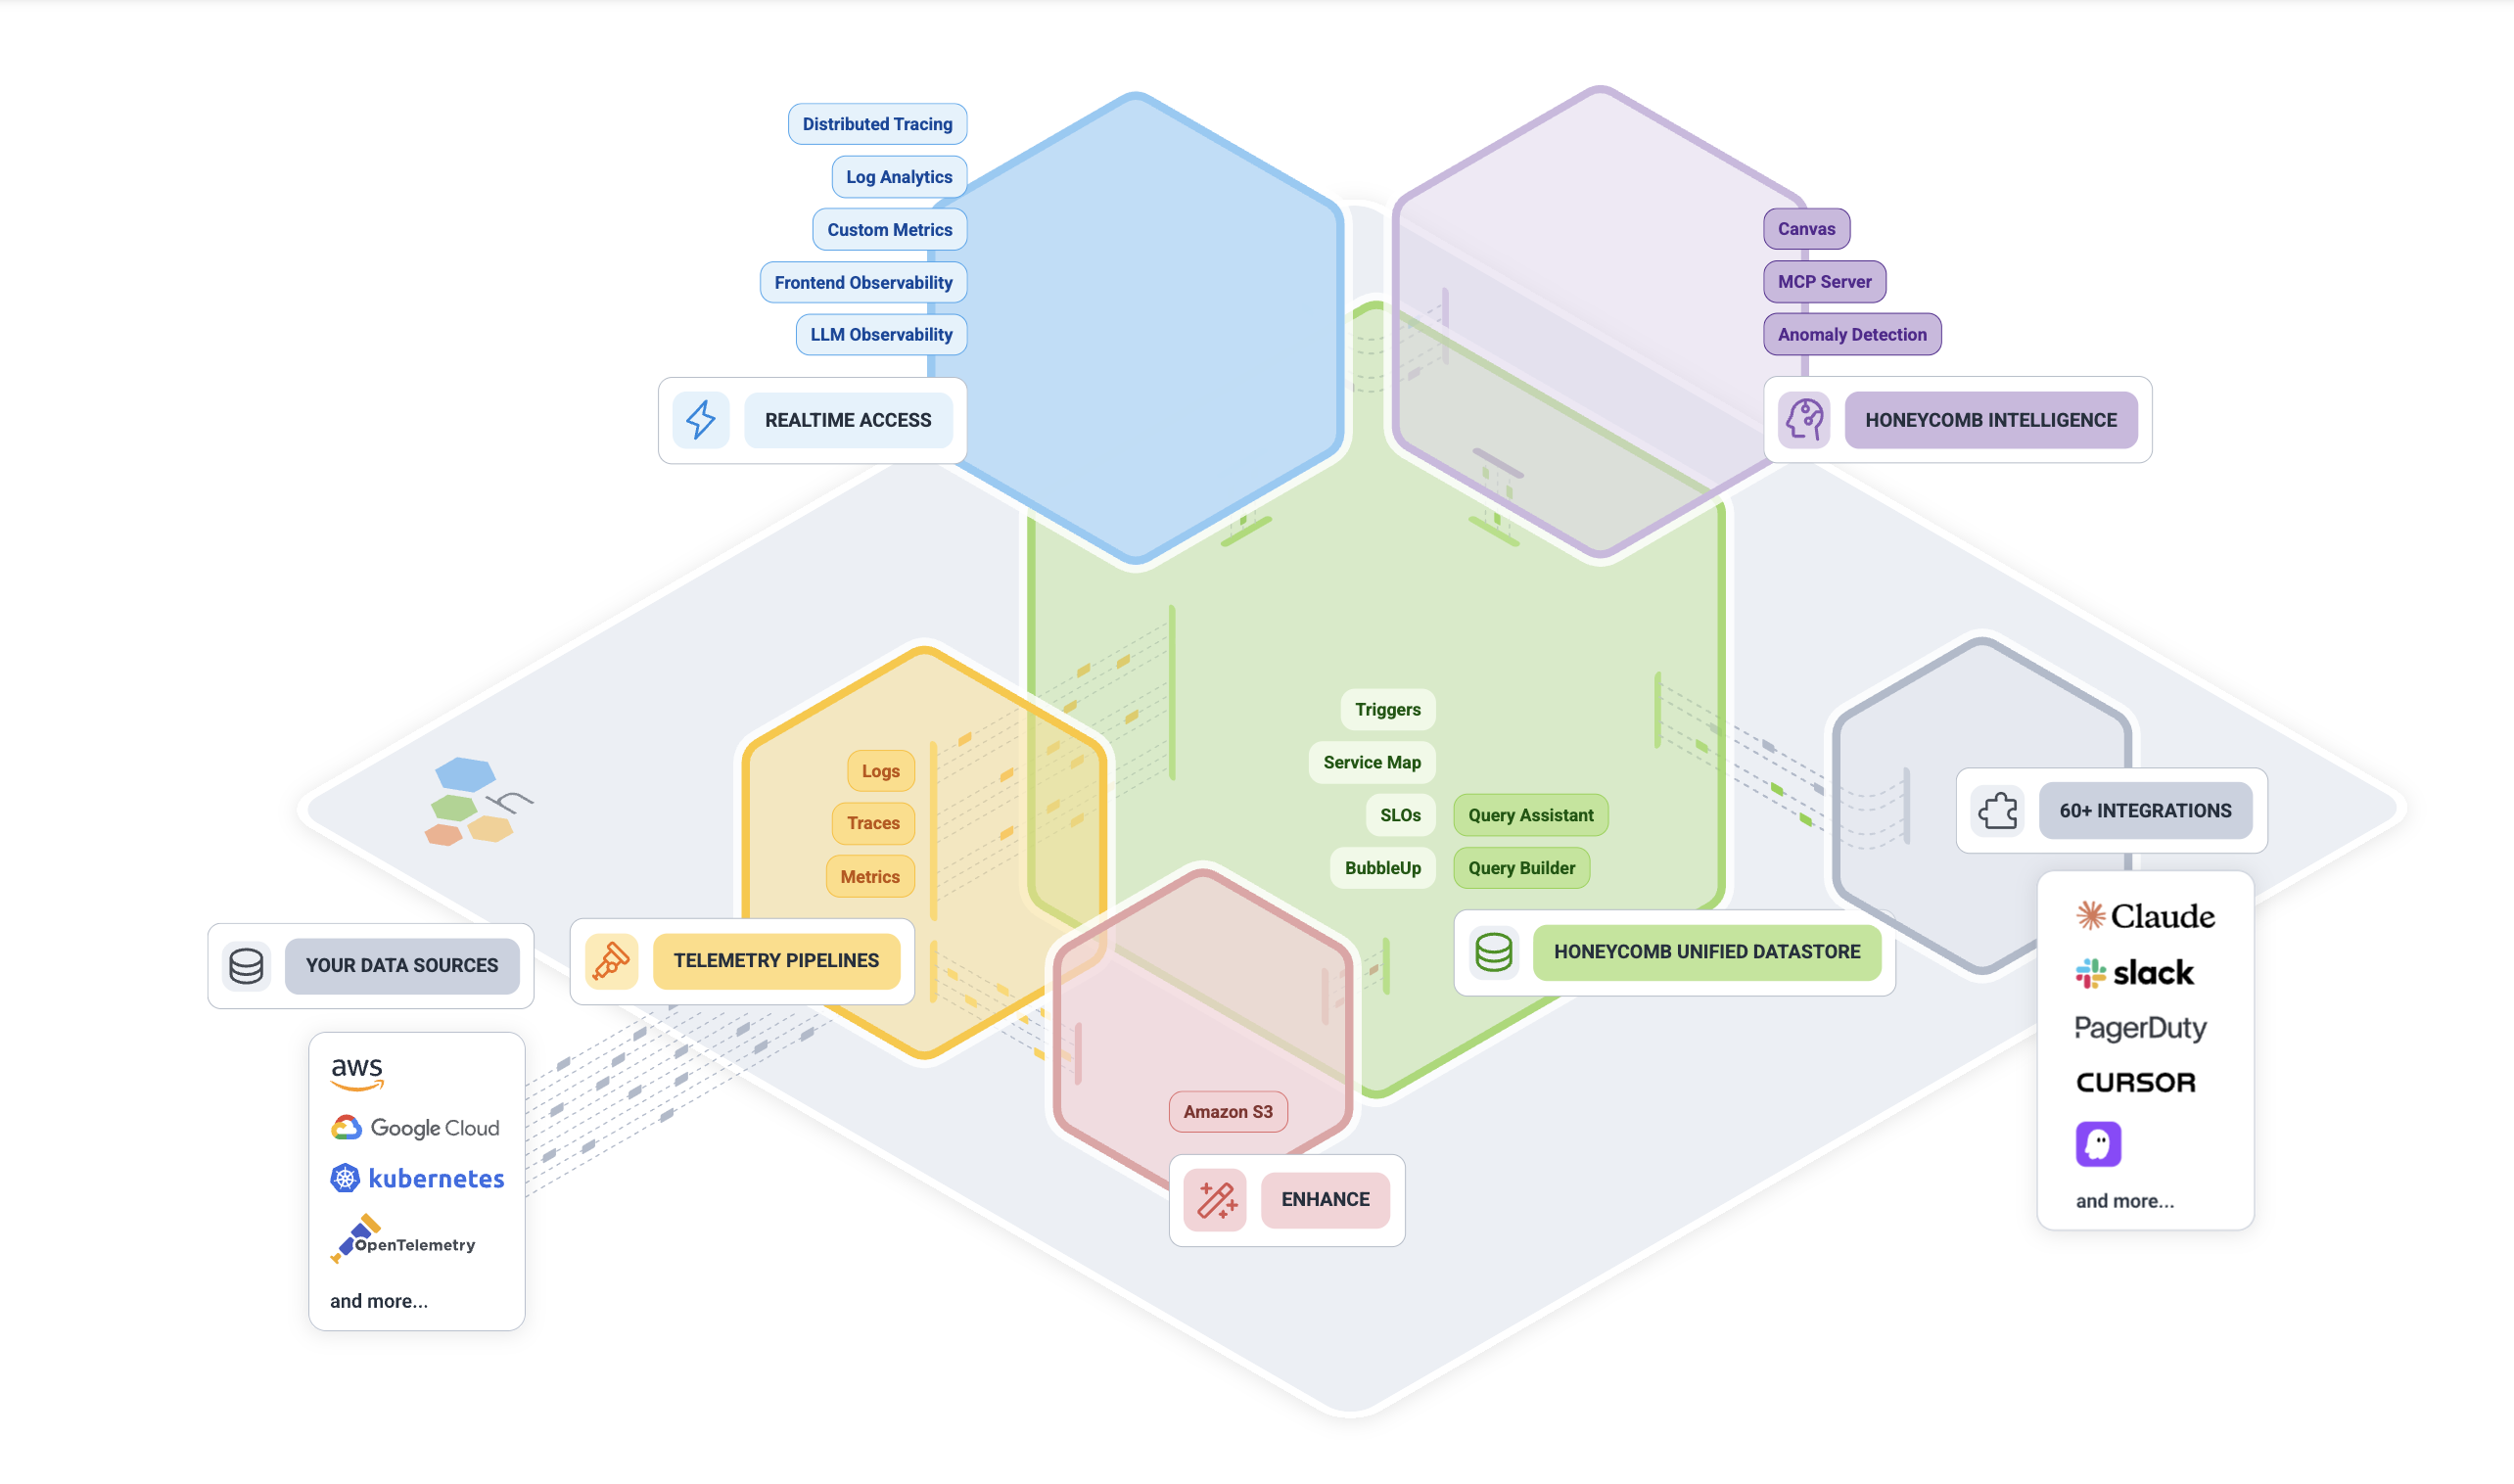
Overview: Honeycomb (founded 2016) is a newer observability platform championing the concept of “observability for developers” and high-cardinality event data. Co-founded by charity Majors, Honeycomb’s philosophy is that production systems are complex and you need to be able to slice-and-dice your telemetry in arbitrary ways to truly debug them – hence the focus on quick, interactive querying of trace and event data. Honeycomb is particularly known for excellent distributed tracing capabilities and helping engineers find needles in haystacks of data by asking iterative questions. It’s SaaS-only and often used alongside open-source instrumentation (OpenTelemetry) which it fully supports.
Key Capabilities:
- High-Cardinality Data Store: Honeycomb uses a columnar store that allows it to handle very high-cardinality data (fields with many unique values) and still query fast. This is crucial when exploring things like "requests by userId" where userId could be millions of values. Many monitoring tools would struggle or pre-aggregate such data; Honeycomb excels at it.
- Fast, Ad-Hoc Querying: The Honeycomb UI lets you craft queries on the fly, filtering and grouping by any combination of fields/tags in your events. It’s built for iterative exploration – you can start broad and then refine filters to drill into an outlier. Query results come back quickly, encouraging experimentation during incident response.
- Distributed Tracing & BubbleUp: Honeycomb's tracing visualizations are powerful. The BubbleUp feature highlights what's different about a subset of traces. For example, if 5 out of 500 requests are slow, BubbleUp can compare those 5 to the 495 fast ones and surface which fields (perhaps a specific feature flag or a particular API endpoint) are correlated with the slow ones. This automates a lot of the "what's unique about these errors?" analysis.
- SLO Tracking: Honeycomb has built-in support for defining Service Level Objectives and error budgets. Because it treats SLOs as a first-class entity, you can get alerts and dashboards that focus on your SLO status (and crucially, it can filter events to only count specific types of errors or specific customers, etc., due to the high-cardinality strength).
- Collaboration & Markers: It allows multiple team members to collaborate during an investigation – you can see each other’s query results, leave notes, and mark interesting events (for instance, mark when a deploy happened on the timeline). This is handy for team problem-solving in real time.
Pros:
- Unparalleled Debugging Ability: For chasing down complex issues, Honeycomb is one of the best. It’s like having a supercharged version of logging and tracing where you can ask any question of your data in real-time. Engineers often find issues with Honeycomb that would be nearly impossible to find with traditional metrics or aggregated logs. It truly shines for those “nasty” problems (race conditions, specific user-only bugs, etc.).
- Built for Modern Dev Workflows: It’s very developer-friendly. The focus on events and traces aligns with how developers think about program execution. The UI and features like BubbleUp feel like they were designed by people who lived on pager duty and wanted a better tool. If your culture is DevOps/“you build it, you run it,” Honeycomb complements that by giving developers direct power to investigate prod issues without guesswork.
- Strong OpenTelemetry Support: Honeycomb was an early adopter of OpenTelemetry and promotes it. You don’t have to use a proprietary agent – you can instrument with open-source OTel SDKs and send data to Honeycomb’s endpoint (it speaks OTLP). This means less lock-in on the instrumentation side. In fact, Honeycomb often educates on how to instrument your code effectively (e.g., adding custom span attributes to expose important variables).
- Scalable SaaS with Predictable Pricing: Honeycomb’s pricing is typically based on usage (event volume) with defined tiers, and it encourages sending rich data rather than sparse metrics. They also have features to prevent unexpected costs (like shedding load if you send too much). For what it offers, customers often find it reasonably priced for the value (especially compared to some competitors that charge a lot for full trace retention).
Cons:
- Limited Metrics/Infrastructure Focus: Honeycomb’s sweet spot is tracing and events. While it can accept metrics (and you could view them as traces of one span, etc.), it’s not a traditional infrastructure monitoring tool. You would likely still need a separate solution for basic server metrics, network monitoring, etc., or use something like AWS CloudWatch in parallel. Honeycomb isn’t a full replacement if you need heavy-duty infrastructure or network observability.
- Trace-Centric, Less Log Aggregation: If your team heavily relies on logs (unstructured text search), Honeycomb is a different paradigm. It expects you to send structured events (which could be thought of as logs, but you have to instrument to get them there). It doesn’t ingest raw log files like an ELK or Splunk would. So adopting Honeycomb might require adding more instrumentation to apps or switching to an event-oriented logging approach.
- Learning Curve in Methodology: The concept of exploratory querying might be new to teams used to dashboards and static alerts. There’s a bit of a learning curve to formulating the right queries and interpreting results. Honeycomb provides good tutorials, but it requires a mindset shift from “I have a dashboard and alerts” to “I investigate by asking the system questions.” This is empowering, but some ops folks may need time to adapt.
- UI for Large Teams/Roles: In a large enterprise setup, you might find Honeycomb lacks some features like complex RBAC (it has team-based access control but not extremely fine-grained controls) or multi-tenant partitioning of data by team. It’s improving, but originally it was targeted at single-team usage. Very strict orgs might need to structure usage carefully (though this is common with many SaaS tools).
Ideal For: Software product teams and SREs responsible for complex microservices, especially where issues are often not straightforward. It’s great for organizations practicing Site Reliability Engineering or DevOps where deep diving into incidents is frequent and necessary. Also ideal for polyglot environments where you want one tool that can ingest all sorts of event data from various services and allow cross-cutting analysis.
Questions to Ask Before Buying:
- “What data should we send to Honeycomb?” – It’s worth strategizing your instrumentation plan. Discuss with Honeycomb on best practices: e.g., which high-cardinality fields are useful (user IDs? request IDs?), how to structure events, and how much to log in spans. Knowing this helps ensure you maximize value without overloading on unneeded data.
- “Do we need to retain traces for long periods?” – Honeycomb often is used for real-time and recent troubleshooting (retaining maybe weeks of data by default). If you need very long-term storage of observability data (months/years) for compliance or trending, ask how that can be handled (they might suggest archiving data to S3 or similar after a period).
- “How does Honeycomb integrate with alerts and paging?” – As an exploratory tool, Honeycomb is not primarily an alert engine (though it does have triggers for SLO breaches and such). Ask how it would fit into your existing monitoring/alerting process. Typically, you’d still have CloudWatch or Prometheus alerts for certain conditions, then jump into Honeycomb to diagnose. Ensure that’s a workflow your team is comfortable with.
- “What is the learning plan for our team?” – If you adopt Honeycomb, invest in onboarding your devs and SREs. Ask if Honeycomb provides training sessions, or use their playbooks to practice on test incidents. Ensuring everyone knows how to query effectively will unleash its full potential during real incidents.
Chronosphere
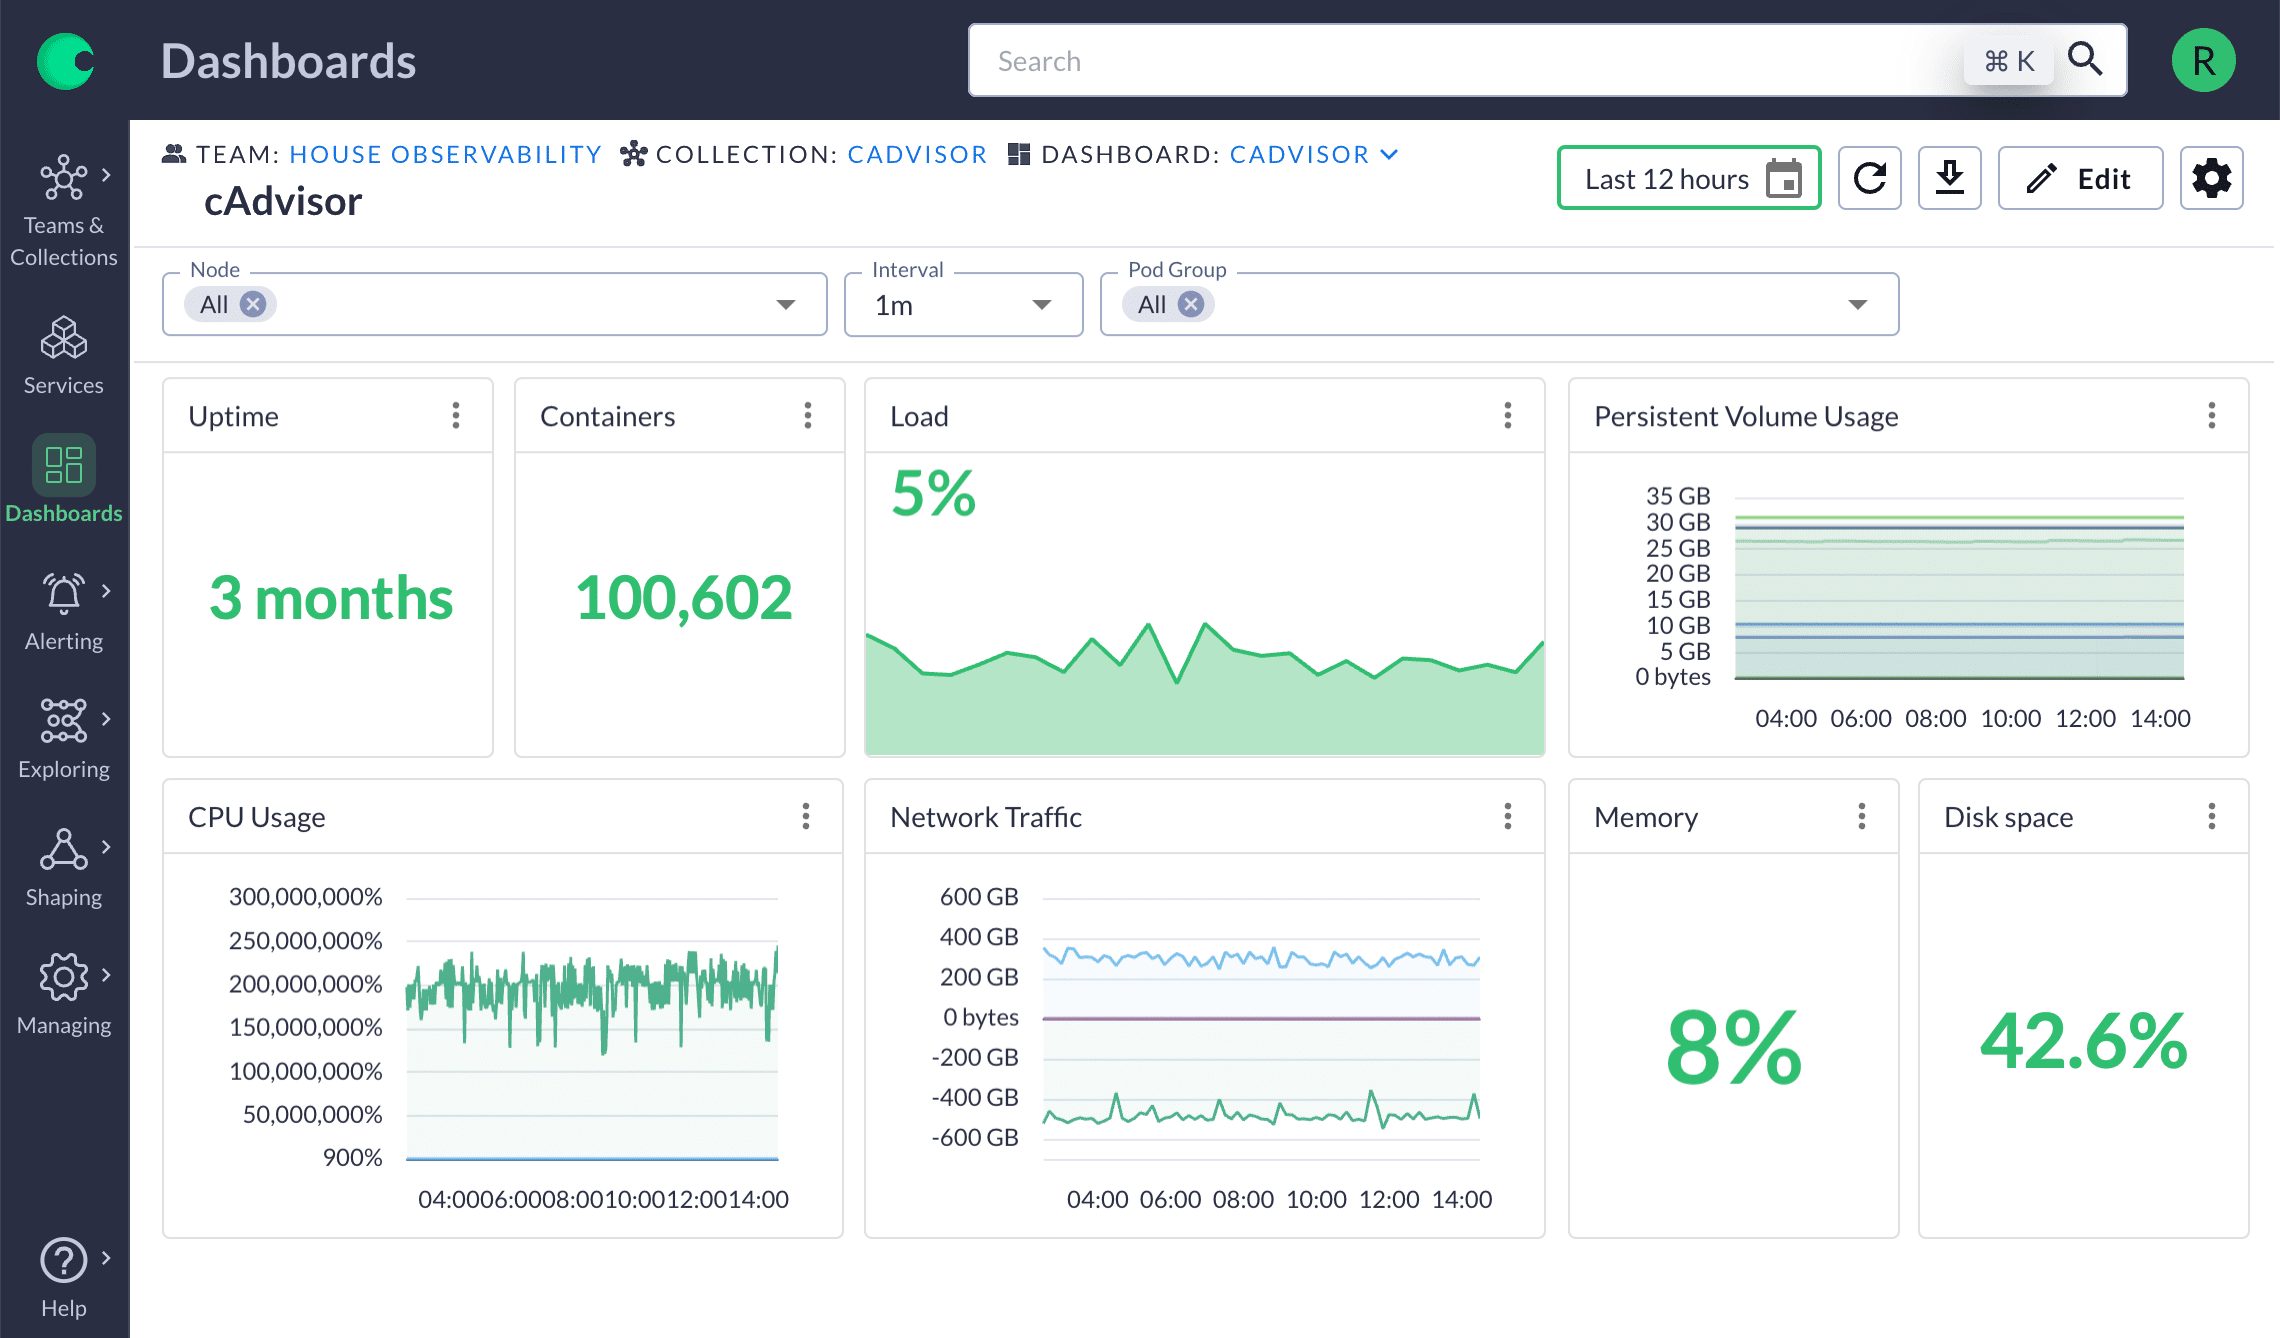
Overview: Chronosphere (founded 2019) is a cutting-edge observability platform built to address the scale and cost challenges of monitoring cloud-native environments. Created by ex-Uber engineers who developed M3 (Uber's open-source metrics database), Chronosphere is designed to ingest massive volumes of metrics (and now logs/traces) while giving customers control to tame the firehose of data. It's a SaaS platform often positioned for large enterprises and hyper-scalers who outgrew the likes of Prometheus or hosted solutions in terms of scale. Chronosphere emphasizes filtering out low-value data and focusing on what matters to reduce costs and improve signal-to-noise.
Key Capabilities:
- Massive Scale Metrics Engine: Chronosphere can handle billions of time-series data points with high availability. It’s one of the few platforms proven to not choke on extremely high-cardinality metric data. This makes it suitable for monitoring thousands of microservices or Kubernetes clusters with detailed metrics.
- Data Control Plane (Drop/Transform): A standout feature is the ability to apply rules at ingestion to drop unnecessary metrics, aggregate data, or transform metrics (e.g., renaming, adding labels) before they are stored. For example, you might drop debug metrics from dev environments or down-sample certain high-frequency metrics. This prevents wasteful data from ever hitting your bill or cluttering dashboards.
- Unified MELT in One UI: Chronosphere has expanded beyond metrics (M3) to also correlate Metrics, Events, Logs, Traces in a single interface. They introduced a Logs pipeline (with a FluentBit-based agent) that similarly allows dropping or converting logs before indexing. While metrics are the core, having logs and traces in the same platform means you can pivot - for instance, see a spike in a metric, then quickly view related traces or sample logs in that timeframe.
- High-Performance Querying: The platform supports PromQL for metrics and offers fast query responses even on large datasets. Chronosphere’s architecture separates hot vs. cold data to optimize recent data queries. They claim to maintain quick querying at scale where other systems might slow down or require heavy aggregation.
- Reliability and SLA Features: Built with SRE principles, Chronosphere provides strong controls for data retention and reliability. It can retain high-resolution data for configurable periods and longer-term downsampled data for trend analysis. It also integrates SLO monitoring features (given its SRE audience) to track service SLIs and error budgets using the data it stores.
Pros:
- Cost Reduction and Efficiency: Chronosphere's customers often report significant reductions in observability data volumes (and costs) - on the order of 50%+ less - by cutting out noise. This is extremely attractive for companies that are drowning in metrics or logs and paying exorbitant fees. Chronosphere essentially pays for itself if it helps avoid runaway data growth.
- Designed for Cloud Native & K8s: With roots in M3 and a strong understanding of Kubernetes, it seamlessly handles ephemeral metrics (like short-lived pod metrics, high churn in time-series). It’s built to ingest Prometheus metrics, so it’s often dropped in as a backend replacement for Prom + Thanos setups, providing a multi-tenant, scalable store behind your existing Prom clients. This means you can keep using familiar tools (Grafana, PromQL) but with Chronosphere under the hood for scale.
- Enterprise Features: Chronosphere includes enterprise needs like role-based access control, team spaces, and compliance (they tout SOC2, etc.). It’s not an open-source project, it’s a commercial product aimed at serious enterprise usage. Support and onboarding for large customers are part of the package, which big companies often need when migrating from a DIY Prometheus stack.
- Future-Proof for Growth: If you anticipate your environment scaling significantly (more microservices, more clusters, more instrumentation), adopting Chronosphere early can save you multiple re-architectures of your monitoring stack. It can scale virtually linearly with your growth. Additionally, with Palo Alto Networks acquiring Chronosphere in late 2025, the platform is likely to get even more investment and integration into broader ecosystems.
Cons:
- Enterprise Focus & Pricing: Chronosphere targets the top 1% scale problems, and its pricing reflects that. It's usually not cost-effective for small or medium teams - in fact, they might not even find a need for it. The platform's ROI shows at very high scale. If you only have a couple of clusters and moderate telemetry, Chronosphere is likely overkill (and they might not prioritize very small deals).
- Metrics-First, Logs/Traces Newer: Chronosphere's log and trace capabilities (often called "Logs 2.0" in their announcements) are relatively new. While they are innovating (like usage analysis for logs), the ecosystem and maturity for logs/traces may lag behind specialized tools. For example, log search in Chronosphere might not be as feature-rich as Splunk's, or trace UI not as deep as Honeycomb's - at least as of 2025. Evaluate if it meets your needs or if you'd still run a separate log solution.
- Vendor Commitment: Adopting Chronosphere means a strong vendor relationship because it’s not a widely standardized solution you can easily switch out. The ingestion APIs (PromQL remote write, FluentBit logs, OTel, etc.) are standard, but once your data is in, migration could be tough due to sheer volume. Also, with the Palo Alto acquisition, consider what that means – likely good in terms of backing, but possibly a shift in strategic direction (aligning more with security use cases too).
- Learning Curve on Control Plane: The benefit of controlling telemetry means users have to define rules - e.g., which metrics to drop or keep. This requires understanding your data well. Initially, teams might not know what's safe to drop and could accidentally remove a metric that's later needed. Chronosphere provides recommendations (and even analytics to show unused data), but it's a new way of thinking about monitoring (managing data proactively, not just collecting everything). It may take time to iterate and fine-tune these controls.
Ideal For: Very large, cloud-native organizations (think tech enterprises, fintech, SaaS at scale) where observability data has grown out of control – either in volume, cost, or both. If you’re running Prometheus at scale with many federations or running into performance issues, Chronosphere is a logical next step. Also, companies moving from monolith to microservices often see an explosion of metrics; Chronosphere can wrangle that. It’s often championed by platform SRE teams who are tasked with providing a centralized monitoring service to many product teams in a big company.
Questions to Ask Before Buying:
- "What data optimization will we achieve and how?" - Have Chronosphere analyze a sample of your telemetry. They often can identify waste (e.g., metrics that no one queries, or high-cardinality labels that provide little value). Ask for a pilot or assessment - what % reduction in data do they predict? Get details on how you'd configure drop/transform rules to hit those savings.
- “How do we migrate from our existing Prom/Graphite/etc. setup?” – Discuss the migration path. Chronosphere can ingest Prometheus remote write, so you might keep your Prom servers. Or you could replace them with Chronosphere Agents. Understand the steps and effort: instrumentations remain the same, but you’ll redirect data flows. Check if they have tooling to help port Grafana dashboards or alerting rules into Chronosphere’s system (to ensure continuity for users).
- “What about our logs and traces strategy?” – If you currently use Splunk, Elastic, or others for logs, talk about whether Chronosphere aims to replace that or augment it. Maybe you’ll keep an existing log solution for deep search, but use Chronosphere logs for short-term troubleshooting with cost controls. Same for traces: can Chronosphere ingest your existing OpenTelemetry traces easily, and does it support the trace volume you have? Clarify where it’s ready to fully take over and where it might not be yet.
- “How does support and onboarding work?” – Given the enterprise nature, you’ll want to know the level of support. Do they offer training sessions for your team? Will you have a dedicated customer success engineer assisting with setting up those data filters and ensuring you’re getting value? Also, with the acquisition, ask if anything changes in account management or support processes. A tool embedded this deeply requires trust that support will be there when you need it.
Sumo Logic
Overview: Sumo Logic (founded 2010) is a cloud-native logging and monitoring platform that provides integrated observability and security solutions. It started as one of the first SaaS log management tools and expanded to cover infrastructure monitoring and application observability. Sumo Logic's Observability suite now includes log management, metrics monitoring, distributed tracing, and even capabilities like Cloud SIEM and SOAR for security operations. It targets companies that want a unified solution without running their own ELK stack or multiple disparate tools. Sumo is entirely SaaS, with a multi-tenant cloud offering (hosted typically on AWS).
Key Capabilities:
- Cloud Log Management: Sumo can ingest logs from virtually any source (apps, servers, network devices, cloud services). It offers a web-based log search and analysis interface, with a proprietary query language (slightly similar to SQL). Users can parse logs, run statistics (count, average, etc.), and create dashboards or alerts from log data. Logs can be tagged with metadata (e.g., source category) to organize and permissions can restrict access as needed.
- Infrastructure & Metrics Monitoring: Sumo provides infrastructure monitoring with a collector agent that gathers host metrics, system stats, Kubernetes stats, etc. These metrics can be visualized in dashboards. Sumo has out-of-the-box apps (pre-configured dashboards/alerts) for common services like AWS Lambda, Nginx, Docker, etc., making setup simpler.
- APM & Tracing: Through its Application Observability modules, Sumo supports OpenTelemetry and other tracing data. You can trace transactions across services and view a service map. While maybe not as granular as Dynatrace or New Relic in APM, it covers the basics: latency distribution, error rates, and per-span details.
- Integrated Security (SIEM/SOAR): Sumo Logic uniquely combines observability with security analytics in one platform. Its Cloud SIEM can ingest security events and logs, apply rules and threat intel, and highlight security incidents. It also has SOAR capabilities for automating responses. This means an ops team and security team could essentially work off the same data store and UI, if desired.
- Continuous Intelligence Insights: Sumo positions itself as delivering insights from your data via machine learning. For example, it has anomaly detection for logs (to catch rare or new log patterns) and outlier detection for metrics. These assist in catching issues without pre-defined thresholds. Additionally, it offers features for AWS Observability (like recognizing new AWS entities or misconfigurations).
Pros:
- All-in-One Platform: Sumo Logic appeals to organizations that prefer a single tool for multiple needs. If you don't want to maintain separate solutions for logs, metrics, traces, and security, Sumo can cover all in one subscription. This unified approach simplifies vendor management and can lower total cost compared to buying, say, Splunk for logs and Datadog for metrics separately.
- SaaS Simplicity: As a true multi-tenant SaaS, Sumo handles the back-end scaling and updates. You don’t manage any infrastructure for it (collectors are lightweight and you can even send data via HTTPS without a collector). They have a proven track record of security and reliability, which is important for cloud-native companies who prefer not to manage logging infrastructure.
- Good Cloud Integrations: Sumo is strong in AWS environment monitoring. For example, it integrates with AWS CloudWatch and S3 for log collection, AWS GuardDuty, etc. The apps for AWS services give instant value (dashboards for Lambda performance, API Gateway logs, etc.). So if you’re heavily on AWS, Sumo has many tailored solutions. Similarly for Kubernetes, Sumo has a Kubernetes App that nicely visualizes cluster health.
- Security + Observability Synergy: Few tools do both. If your DevOps and Security teams are open to it, having them on one platform means fewer data silos. For instance, during an outage you might catch that it was triggered by a security event (like a spike in unauthorized access attempts), or vice versa. It can break down barriers between traditionally separate domains (some call this “SecOps” convergence).
Cons:
- Depth vs. Breadth: While Sumo covers many areas, some specialists might find it less deep than dedicated tools in each category. For example, Splunk may handle extremely complex log queries or huge log volumes better; Datadog might have more APM detail or a more sophisticated UX for traces; Dynatrace might do more automated root cause. Sumo is broad, but if you need the absolute best in one domain, you might compare its capabilities carefully.
- Proprietary Query Language: Users have to learn the Sumo Logic query language for analyzing logs (and metrics to some extent). It’s not standard SQL and not the same as Splunk’s or Elastic’s, so it’s a new thing to learn. Though it’s fairly straightforward, it’s something to consider for team training.
- Potential Cost at Scale: Sumo’s pricing is generally based on data volume (with different plans for retention and features). At very high data volumes (like many terabytes/day of logs), any SaaS can become expensive compared to self-managed solutions. You’d need to watch what you ingest (like exclude debug logs) to control costs. They do offer credits and cold storage options, but it requires active cost management.
- Vendor Viability and Focus: Sumo Logic went through an acquisition by a private equity firm in 2023, meaning it’s no longer publicly traded. Sometimes, such transitions can affect product investment or support. While Sumo has been stable, one should keep an eye on their roadmap and ensure they continue to innovate. Also, being not as big a name as Splunk or Datadog, some stakeholders might need assurance of Sumo’s long-term stability (though it’s been around a long time).
Ideal For: Mid-sized companies to enterprises that want a consolidated observability and security monitoring solution. Especially good for teams that are cloud-first and don’t want to manage monitoring infrastructure. Sumo sees usage in tech companies, financial services, and increasingly in any organization adopting cloud and DevSecOps practices. It’s also a fit for teams who outgrew DIY ELK stacks and want a worry-free hosted service with similar capabilities plus more. If you’re already a Sumo customer for logs, extending to use their metrics and tracing can simplify your stack significantly.
Questions to Ask Before Buying:
- “What data volume and retention do we need?” – Calculate how much log data (in GB/day) and metrics (time-series or DPM) you generate, and decide how long each needs to be retained (e.g., logs 30 days searchable, older archived to S3?). Sumo’s pricing has tiers for retention, so get a custom quote that matches your needs. Also, ask about any overage protection or ingest caps to avoid surprise bills.
- “Can Sumo replace all our current tools?” – Make a list of current tools (Splunk, Nagios, AppDynamics, etc.) and see which ones Sumo can replace immediately, and which might be phased later or kept. The value increases if you consolidate more onto Sumo, but ensure it meets the critical needs of each (e.g., does it support that one key log regex your security team uses? Does it capture that one type of custom metric your ops rely on?). Maybe run a trial with test data for each area.
- “How do we handle sensitive data and compliance?” – Since Sumo is multi-tenant SaaS, confirm it has the certifications you need (SOC 2, HIPAA, etc. – it does for many). Ask about data encryption and if you can tokenize or mask sensitive fields on ingestion (Sumo has features for masking PII in logs). Also clarify what region your data will reside in (they have different deployment regions).
- “What is the onboarding and support level?” – Inquire about the onboarding process. Sumo often provides help to set up the first collectors and create initial dashboards (especially for enterprise plans). Understanding how they’ll assist your team in migrating and training users is key. Also check what support is included – 24/7 support, dedicated CSM, etc., depending on your subscription level.
How to Choose the Right Tool: Step-by-Step Checklist
Selecting a cloud observability platform is a significant decision. Here's a step-by-step checklist to guide your evaluation process and ensure you choose the tool that best fits your needs:
- Define Your Requirements and Priorities: Start by identifying what you need from an observability solution. List the types of telemetry you must cover (logs, metrics, traces, etc.) and any specific goals (e.g., “improve MTTR for outages” or “reduce logging costs” or “monitor Kubernetes clusters”). Rank what matters most – for example, deep APM capabilities vs. log analytics vs. ease of use. This clarity will help filter options.
- Audit Your Environment and Stack: Take inventory of your technology stack and scale. How many services and instances do you run? Are you cloud-only, multi-cloud, hybrid? Do you use containers and orchestration (Kubernetes)? What programming languages and frameworks are in play? Ensure the tool you pick has first-class support for your stack (integrations for your AWS services, or an agent that runs on your OS, etc.). Also note any compliance or data residency requirements at this stage.
- Establish Data Volume Expectations: Estimate how much data you will send into the observability platform. Typical considerations: average log volume per day, number of metrics time-series, number of traces or span events per second. This will heavily influence cost and tool viability. Some tools handle large volumes better or more cheaply than others. Having rough numbers lets you evaluate pricing realistically (and avoid unpleasant surprises later).
- Consider Integration with Existing Tools: Map out how the new platform will fit into your workflows. Do you need it to integrate with Slack, PagerDuty, Jira, or other incident management tools? Should it connect to CI/CD pipelines or Git for instrumentation? If you have an existing monitoring or logging setup that you’ll keep partially, can the new tool ingest data from it (e.g., integrate with Prometheus or CloudWatch)? Prioritize platforms that play nicely with your ecosystem to avoid data silos.
- Evaluate Vendor Offerings Against Criteria: Using your requirements, evaluate each candidate vendor. Create a matrix of criteria (the ones in the “How We Evaluated” section above are a good starting point). For each tool, research or run a trial to see how it scores. For instance, Signal coverage: Does it truly handle logs, metrics, and traces equally well? Usability: Have some team members try creating a dashboard or writing a query – is the learning curve acceptable? Open standards: Will you be locked in or can you reuse OpenTelemetry? This systematic approach prevents overlooking any critical feature.
- Conduct Trials or Proof-of-Concepts: Narrow down to 2–3 top contenders and do a hands-on trial with your data. Most vendors offer a free trial or will assist with a proof-of-concept (POC). In the trial, instrument a subset of your apps and send data in. Then mimic common tasks: view dashboards, troubleshoot a simulated incident (e.g., spike some error rate), test alerting, etc. Assess performance (query speeds, UI responsiveness) and how much effort it took to get value. Involve actual end-users (engineers, SREs) in this process and gather their feedback.
- Compare Pricing and TCO: Request detailed pricing quotes from vendors based on your actual usage (from the trial data or your estimates). Calculate the total cost of ownership over, say, 3 years. Include not just license/subscription costs but also ancillary costs: if self-hosting, include infrastructure and manpower; if one tool requires more training, factor that in. Sometimes a tool with a higher sticker price might require less admin effort (saving engineer hours). Look at pricing models (ingest-based, host-based, etc.) and consider which aligns best with your usage patterns (for example, a host-based model might be costly if you have many short-lived containers).
- Check References and Community Feedback: Before finalizing, talk to references or check community reviews. See if you can find customers similar to your organization who use the tool. Ask about support responsiveness, reliability (any outages?), and whether the tool delivered the promised benefits. Online forums or peer review sites can also provide insight into common pros/cons experienced in real deployments.
- Plan for Onboarding and Team Buy-In: The best observability tool is one your team will actually use. Ensure that whichever solution you choose, you have a plan to onboard the team. This might involve training sessions, internal champions/experts for the tool, and gradually rolling out features (maybe start with metrics and add tracing later, etc.). Consider the cultural aspect: if developers are not used to looking at traces or logs, you’ll need to encourage new habits. Some vendors offer onboarding assistance – leverage that.
- Review and Iterate: Once you’ve chosen and implemented a tool, periodically review if it’s meeting your needs. Set some success metrics upfront (like “Did our MTTR improve by X?”, “Are we catching issues we used to miss?”, “Did we sunset legacy systems and save costs?”). If not, work with the vendor or adjust configurations. Observability is not a one-and-done effort – as your systems evolve, continuously tune what you monitor, your alert thresholds, and even evaluate new tools or features as needed (for instance, adopting new AI ops features or enabling additional integrations).
By following these steps, you’ll make a well-informed decision and set up your team for success with whichever observability platform you choose. Remember that the goal is not just to collect data, but to derive actionable insights that make your systems more reliable and your troubleshooting more efficient.
Frequently Asked Questions
What are the best observability tools?
Q: What are the best observability tools?
A: The "best" observability tools depend on your needs, but as of late 2025 some top platforms include Datadog, New Relic, Dynatrace, Splunk Observability, Grafana Stack (Prometheus + Grafana), Elastic Observability (ELK Stack), Honeycomb, Chronosphere, Sumo Logic, and AppDynamics. Each excels in different areas: for example, Datadog and New Relic offer broad end-to-end feature sets; Dynatrace and AppDynamics provide advanced APM with automated insights; Splunk and Elastic are leaders in log analytics; Grafana/Prometheus is ideal for open-source flexibility; Honeycomb is great for deep microservice debugging with traces; and Chronosphere focuses on cost-effective scale for metrics. The best choice will match your specific use case - often organizations use a combination of tools. (Refer to our Quick Shortlist above for recommendations by use case.)
What are cloud-native tools?
Q: What are cloud-native tools?
A: "Cloud-native tools" are software tools designed to operate in modern cloud environments characterized by containers, microservices, dynamic orchestration, and elastic scalability. These tools are built to embrace the Cloud Native Computing Foundation (CNCF) principles - they are often containerized, scalable, and resilient. In the context of observability, cloud-native tools include things like Prometheus (for metrics in container environments), Kubernetes itself (with its native monitoring APIs), Jaeger or OpenTelemetry (for distributed tracing in microservices), and Fluentd/Fluent Bit (for log collection in containers). Cloud-native observability tools are optimized for the ephemeral and distributed nature of cloud apps - for example, automatically discovering new containers, aggregating data from many microservices, and handling multi-region deployments smoothly. Essentially, a cloud-native tool is one that was "born in the cloud" and helps manage or observe cloud-centric technologies (like Docker, Kubernetes, serverless functions) by using architectures and practices suited to those environments.
What are the 4 C’s of cloud-native security?
Q: What are the 4 C’s of cloud-native security?
A: The "4 C's" of cloud-native security refer to four layers that must be secured in cloud-native systems: Code, Container, Cluster, and Cloud.
- Code: The application code itself - ensuring use of secure coding practices, dependency scanning, and code reviews to eliminate vulnerabilities before apps are built.
- Container: The container image and runtime - this involves scanning container images for vulnerabilities, using minimal base images, and applying container runtime security (like not running as root, using read-only file systems).
- Cluster: The orchestration environment (e.g., Kubernetes cluster) - securing cluster components (API server, etcd), using network policies, proper authentication and RBAC for cluster access, and keeping the cluster and its add-ons up-to-date.
- Cloud: The underlying cloud infrastructure - ensuring your cloud (IaaS or PaaS) is configured securely, using cloud provider security services, and managing things like IAM roles, storage bucket policies, and network security groups properly.
These layers build on each other (often visualized as concentric rings: code inside container inside cluster inside cloud). A weakness in an inner layer (like code) can be mitigated by outer layers (like cluster policies), but all four layers should be addressed for comprehensive cloud-native security. By systematically addressing security at each "C," organizations create a defense-in-depth for their cloud-native applications.
What is cloud-native observability?
Q: What is cloud-native observability?
A: Cloud-native observability is the ability to understand and troubleshoot cloud-native systems (those built with microservices, containers, dynamic orchestration) by collecting and analyzing telemetry from those systems. It extends traditional observability (logs, metrics, traces) to handle the unique challenges of cloud-native environments - such as highly ephemeral components, polyglot services, and distributed dependencies. Cloud-native observability solutions are designed to automatically track rapidly scaling or changing infrastructure (e.g., containers coming and going), correlate data across a distributed architecture, and provide insights into both application and platform layers (like Kubernetes). Practically, this means using tools like Prometheus/Grafana, Fluent Bit, service meshes, or vendors that specialize in cloud-era architectures (like Datadog or New Relic's Kubernetes support) to ensure you have end-to-end visibility. It also often involves leveraging OpenTelemetry for consistent instrumentation across microservices. The goal of cloud-native observability is to maintain the same (or better) level of insight and debuggability in complex, dynamic cloud environments as we had in simpler, static server setups - so DevOps teams can detect issues, trace requests, and optimize performance despite the inherent complexity of cloud-native systems.
Conclusion
In summary, today's observability landscape offers a range of powerful platforms - each with different strengths to fit various needs. All-in-one SaaS platforms like Datadog and New Relic are great for teams wanting broad coverage with minimal setup, whereas open-source stacks like Grafana/Prometheus or Elastic give you maximum control if you have the expertise. Enterprise APM suites (Dynatrace, AppDynamics, Splunk) shine in large, complex environments where automated insights and integration with business context are crucial. Meanwhile, newer entrants such as Honeycomb and Chronosphere address emerging needs - deep microservice debugging and cost-effective scaling, respectively - that traditional tools may struggle with.
When choosing the right observability solution for 2026, focus on who will be using it and for what:
- If you’re a startup or small team, you might prioritize ease of use and cost – a managed open-source service or a usage-based SaaS with a free tier could be ideal.
- For cloud-native product companies, tools that handle Kubernetes and microservices gracefully (and support OpenTelemetry) should top your list.
- Enterprise or regulated industry? Look at the proven players with strong security, compliance, and support, like Dynatrace, Splunk, or Cisco’s AppDynamics – they excel at full-stack monitoring with governance features.
- If controlling costs and data volume is a pressing pain point, consider innovative solutions like Chronosphere or explore usage optimization features of whichever platform you use.
- And importantly, ensure the tool aligns with your team’s workflow – an observability platform is only valuable if your engineers actually use it during incidents and for performance tuning.
With a clear understanding of your requirements and the strengths of each vendor, you can confidently select a platform that will become a force-multiplier for your reliability and efficiency. Remember that observability is a journey: whichever tool you choose, invest time in proper instrumentation, dashboarding, and training so that your team gains maximum insight from your systems. With the right choice, you’ll empower your engineers to find and fix issues faster, optimize system performance, and ultimately deliver a better experience to your users.