Getting Started with Google Compute Engine: A Practical Overview
.png)
Introduction
Google Compute Engine (GCE) is one of the foundational services in Google Cloud Platform (GCP). It provides Infrastructure as a Service (IaaS) by letting you run virtual machines (VMs) on Google’s global infrastructure. Engineers value it for its flexibility, predictable performance, and the ability to scale workloads without heavy upfront costs.
In this blog, we’ll take a closer look at google cloud compute engine, from how pricing works to monitoring, dashboards, latency, health, and useful best practices. The goal is to help you understand—not just what it is, but how to make the most of it.
What is Google Compute Engine?

At its core, google compute engine gives you VMs that can run Linux or Windows, on demand or with long-term reservations. You can choose from a wide range of machine types, including:
- General purpose (e2, n2, n2d, t2d, etc.)
- Compute-optimized (c2, c2d) for CPU-heavy tasks
- Memory-optimized (m1, m2) for databases and in-memory analytics
- Accelerator-optimized with GPUs and TPUs
Unlike traditional hosting, you’re not tied to hardware—you can resize, scale, and replicate workloads across regions and zones.
Google Compute Engine Performance
One of the big reasons engineers turn to GCE is performance. VMs boot quickly, networking is backed by Google’s private backbone, and disk I/O is consistent.
A few things worth noting:
- Sustained throughput: With custom machine types, you can tailor vCPU and RAM for exact workload needs instead of paying for unused resources.
- Persistent Disk performance scales with volume size, offering predictable IOPS.
- Network latency is generally low when operating across Google’s regions, making it suitable for latency-sensitive workloads like gaming or financial transactions.
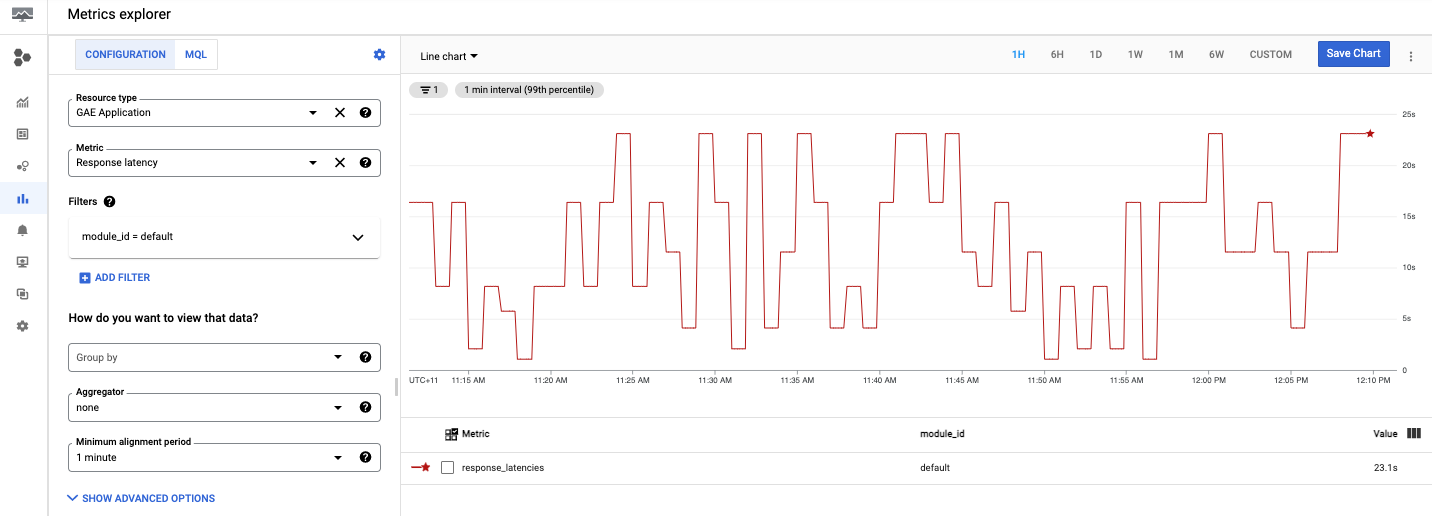
Monitoring google compute engine metrics—like CPU utilization, memory, disk I/O, and latency—is essential. Google Cloud Monitoring gives you deep insight into compute engine statistics and helps you compare performance trends over time.
Google Compute Engine Dashboard & Monitoring
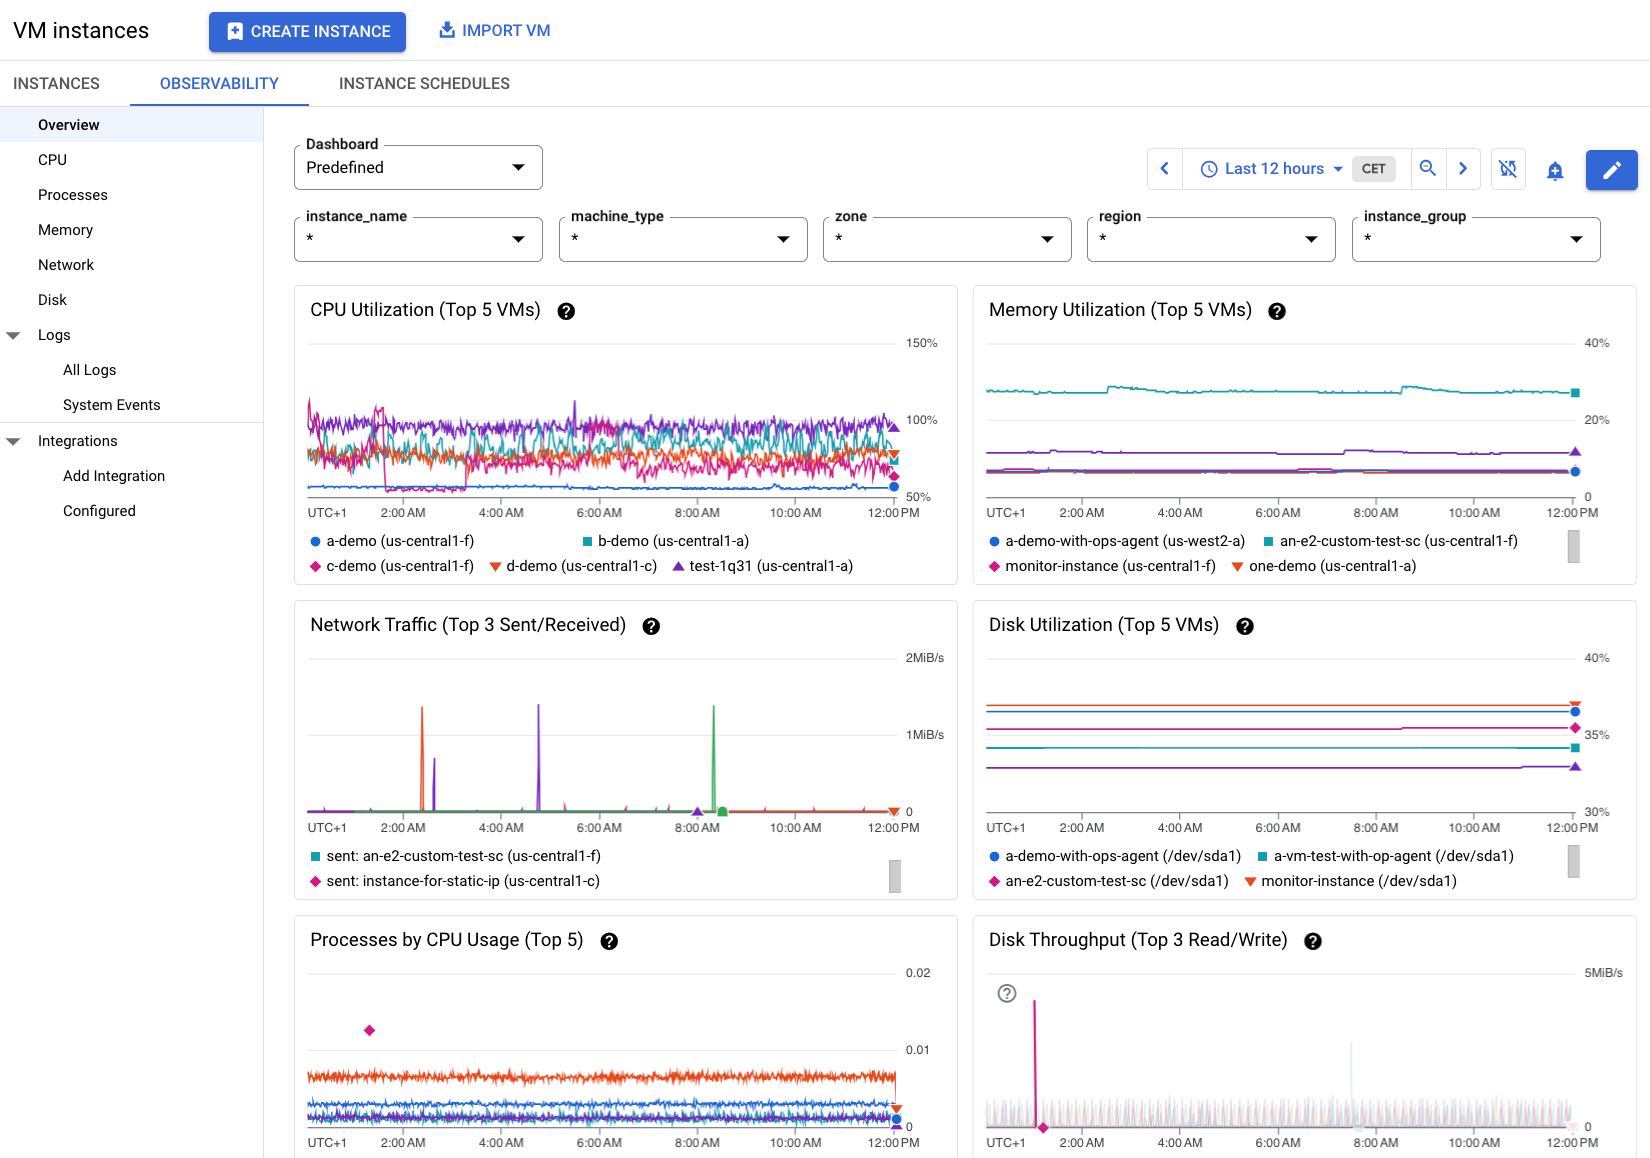
When you log into the google compute engine dashboard, you’ll see an overview of:
- Running VMs, zones, and machine types
- CPU and memory usage trends
- Cost breakdown per project or instance
- Alerts triggered on metrics like CPU, memory, and network usage
To monitor google compute engine in detail, Cloud Monitoring (formerly Stackdriver) is the native tool. It lets you:
- Create charts and custom views.
- Set up alerts (e.g., CPU > 85% for 5 minutes)
- Track health with uptime checks and synthetic monitoring.
- Export logs and compute engine statistics to BigQuery for long-term trend analysis
For operations teams, having alerts and dashboards ensures that issues are detected early and performance is transparent.
Google Compute Engine Pricing & Cost Management
Understanding google compute engine pricing is crucial. While cloud pricing can get complex, GCE has a transparent model:
- On-demand pricing – pay per second with a one-minute minimum.
- Sustained use discounts – up to 30% discount automatically when VMs run most of the month.
- Committed use discounts – save up to 57% by committing to 1- or 3-year terms.
- Spot VMs (preemptible) – up to 91% cheaper for fault-tolerant workloads.
Tools like the Google Cloud Pricing Calculator make it easier to plan workloads and estimate google compute engine cost ahead of time.
Example:
- A small e2-medium instance (2 vCPUs, 4 GB RAM) costs ~$25/month in us-central1 (excluding storage).
- A compute-optimized c2-standard-8 instance runs higher but can outperform multiple smaller general-purpose VMs for CPU-intensive tasks.
For FinOps teams, the compute engine dashboard and cost reports help track spending. You can also export billing data to BigQuery to run advanced queries on compute engine stats and cost allocation.
Latency, Health, and Reliability
Two aspects often overlooked are latency and health:
- google compute engine latency is reduced by Google’s global network. Deploying across multiple regions helps serve users closer to their location.
- google compute engine health checks, coupled with live migration, keep workloads running during maintenance without downtime.
- Built-in google compute engine alert rules for health events help operators act before users notice an issue.
For critical systems, combining GCE with managed load balancing and multiple zones minimizes risk of outages.
Practical Use Cases
- Web applications – scalable frontend and backend VMs with managed load balancing.
- Databases – memory-optimized instances for MySQL, PostgreSQL, or in-memory caching.
- Big Data & AI – GPU/TPU instances for ML training, with high throughput disk storage.
- CI/CD environments – ephemeral compute for builds, testing, and pipelines.
Best Practices for Monitoring & Cost Control
- Set baseline alerts: CPU >80%, disk usage >70%, latency spikes.
- Use labels: tag VMs by team, environment, or project to slice cost and performance data.
- Right-size instances: monitor utilization and move from overprovisioned to optimized VM types.
- Automate shutdowns: schedule dev/test environments to stop after work hours.
- Review google compute engine statistics monthly: check usage trends, anomalies, and spending growth.
Conclusion
Google Cloud Compute Engine is more than just a VM hosting service—it’s a flexible, performance-driven, cost-aware platform that scales with your needs.
For engineers and FinOps practitioners, the key takeaway is to use the visibility— compute engine metrics, stats, dashboards, and alerts—to make smarter decisions. Whether you’re running small applications or enterprise-scale workloads, GCE delivers the balance of performance, transparency, and cost optimization that cloud infrastructure should provide.